
Random Quote Board
A Test of Different RBDS / RDS Demodulators Using Gnu Radio
I've already created a post on demodulating RBDS signals. I've since decided to dive into it a bit, nay, a lot deeper. We're talking Marianas Trench of deep dives.
What is RDS / RBDS?
Quick overview: The RDS (European) / RBDS (American) signal is that 57 kHz subcarrier you find on FM broadcast stations. It's a digital signal modulated using binary phase shift keying (BPSK), carrying information such as the name of the station, title of songs, name of the singer, the date and time, and even advertisements. You can demodulate and decode that information, if you have the correct receiver. Gnu Radio gives you the ability to demodulate the bitstream, and then it gives you the ability to decode the bitstream to recover the original information if you have the gr-rds plugins for Gnu Radio. I was able to load the plug-in using the Linux Mint Software Manager. Otherwise, you might have to create the plugin from source.
How RDS Signals Are Made (Or Maybe Not)
You see, there's a Mommy RDS signal and a Daddy RDS signal... no... that's not how it works.
According to the NRSC-4 specification, the general flow is:
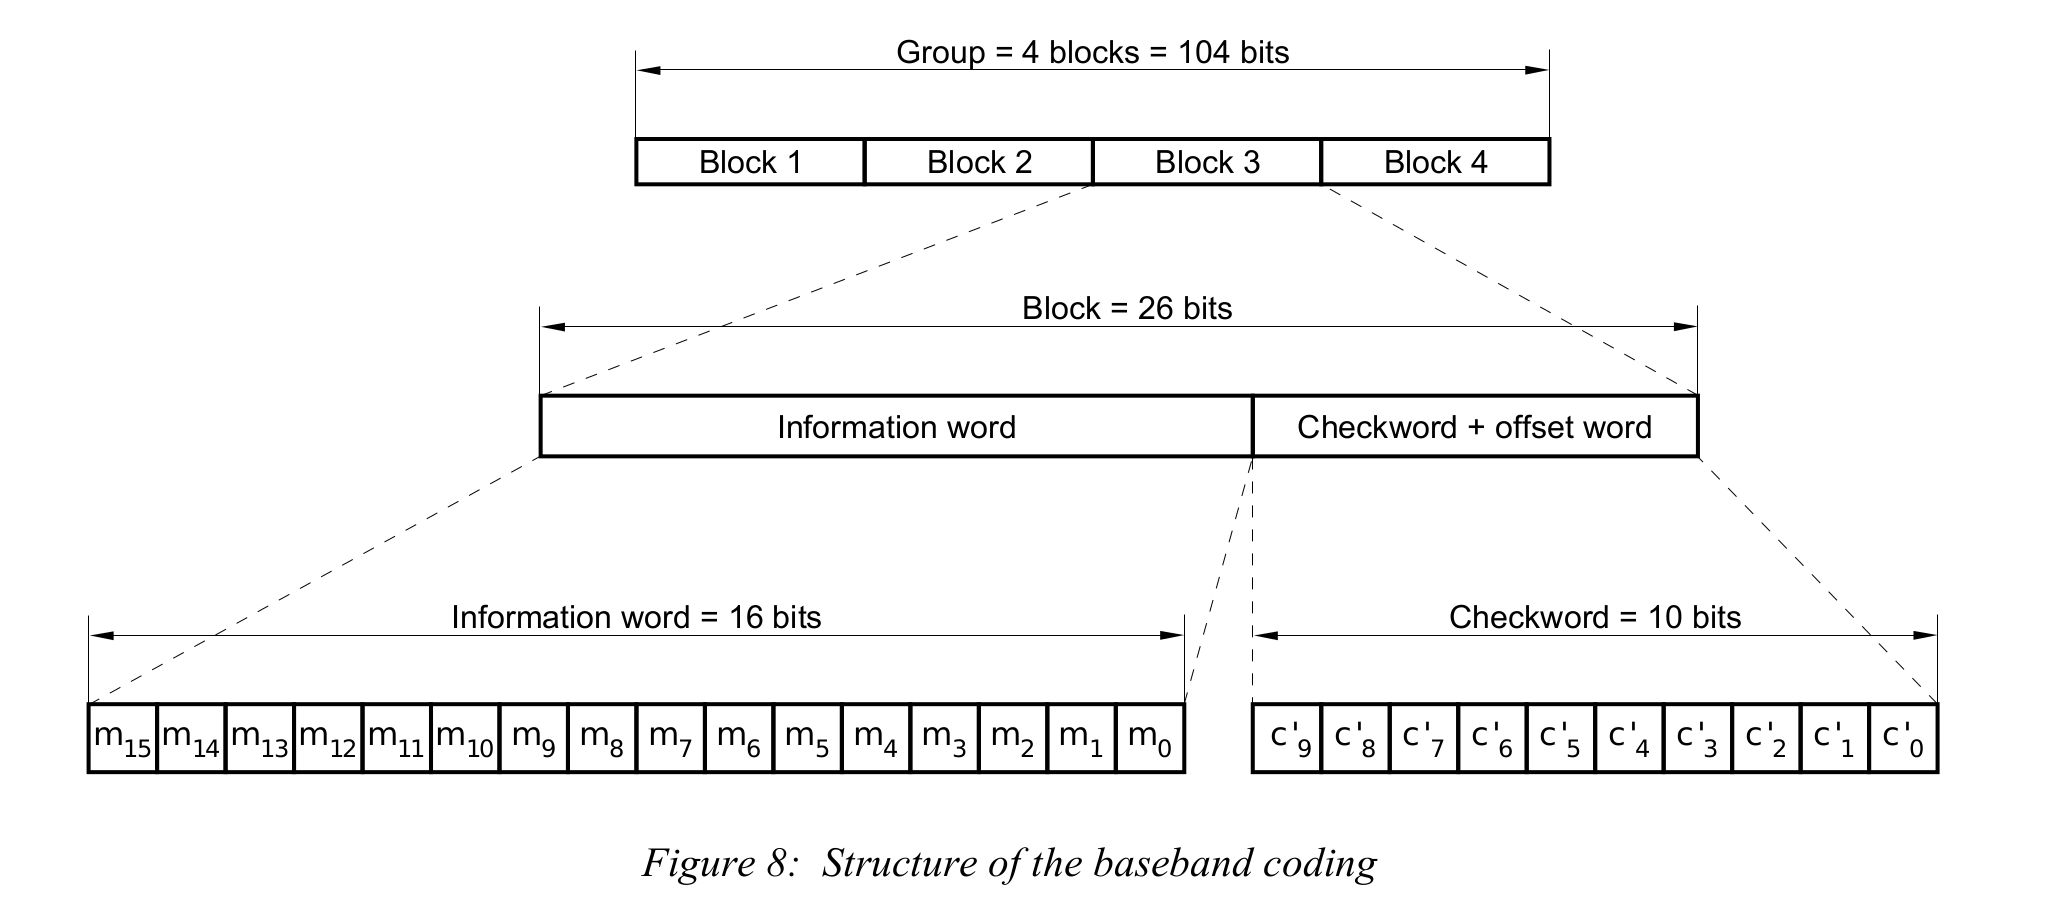
- The system creates the data stream. It consists of 16 bit information word, with each information word followed by a 10 bit checkword. (NOTE: I'm assuming this is a standard rectangular pulse bitstream.) The checkword also provides forward error correction (FEC). The combination of the information and check word is a 26-bit block. Four of these 26-bit blocks create one group. A group is 26 x 4 = 104 bits long. The bit rate is, by modern standards, slooooow. The bit rate is 57 kHz / 48 = 1187.5 bps. Over two and one-half hours of such data, information and checkword both, could fit onto an old 3.5" floppy disk.
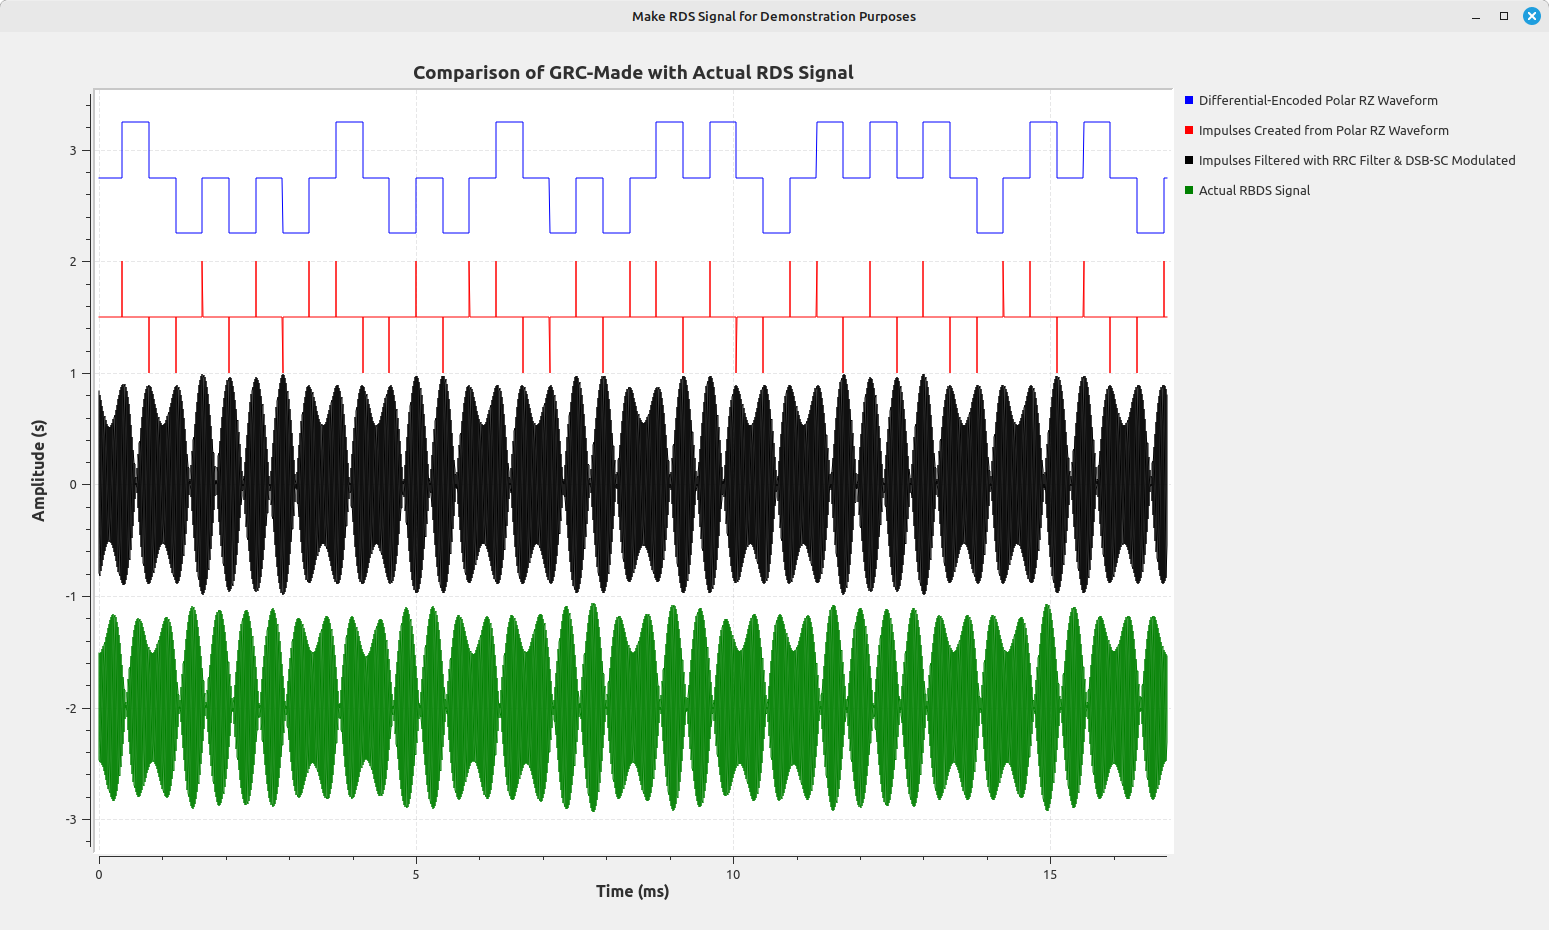
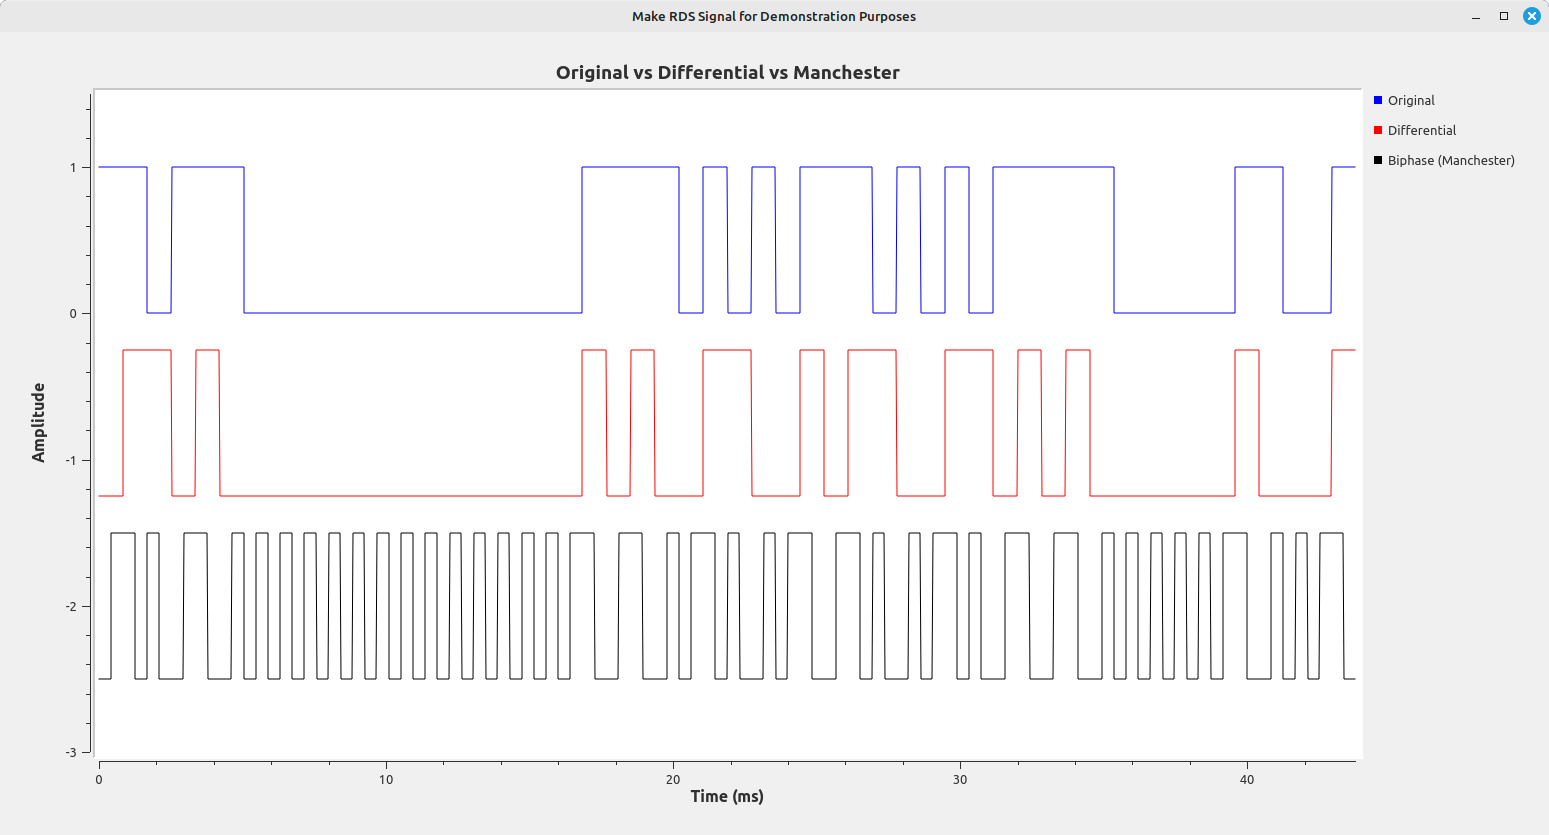
- The bit stream is fed into a differential encoder. This encoder turns every digital 1 to a change from 1 to 0 or 0 to 1, while a 0 is no change.
- The differentially-encoded bit stream is turned into a series of impulses, essentially creating a return-to-zero (RZ) waveform.
- The waveform is Manchester encoded to get rid of any DC bias.
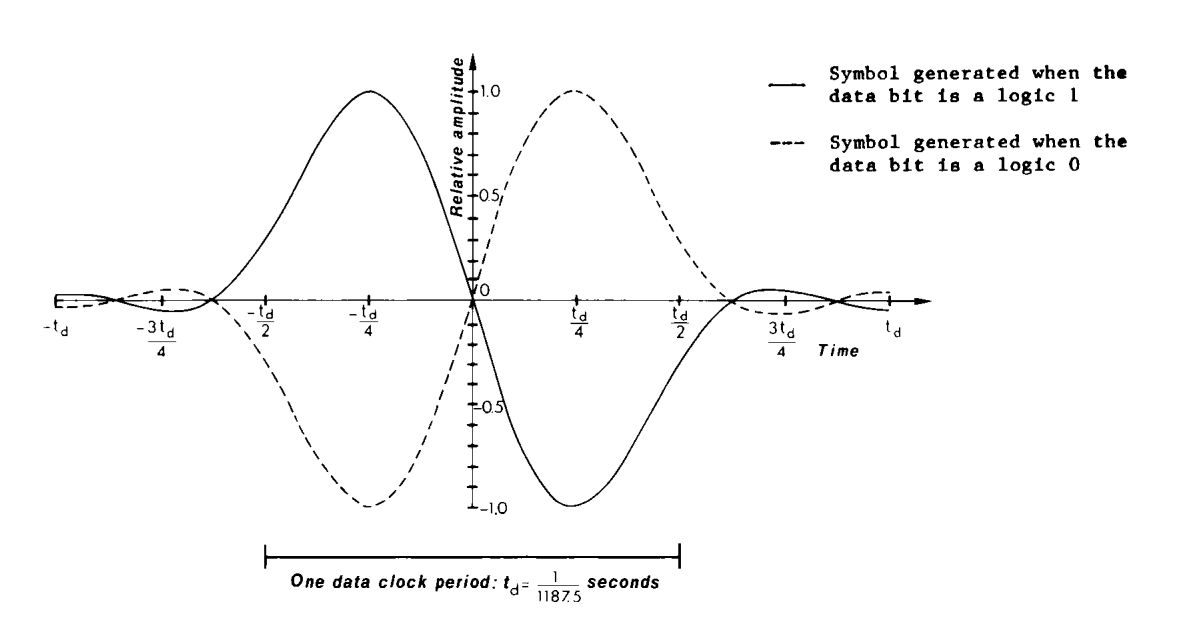
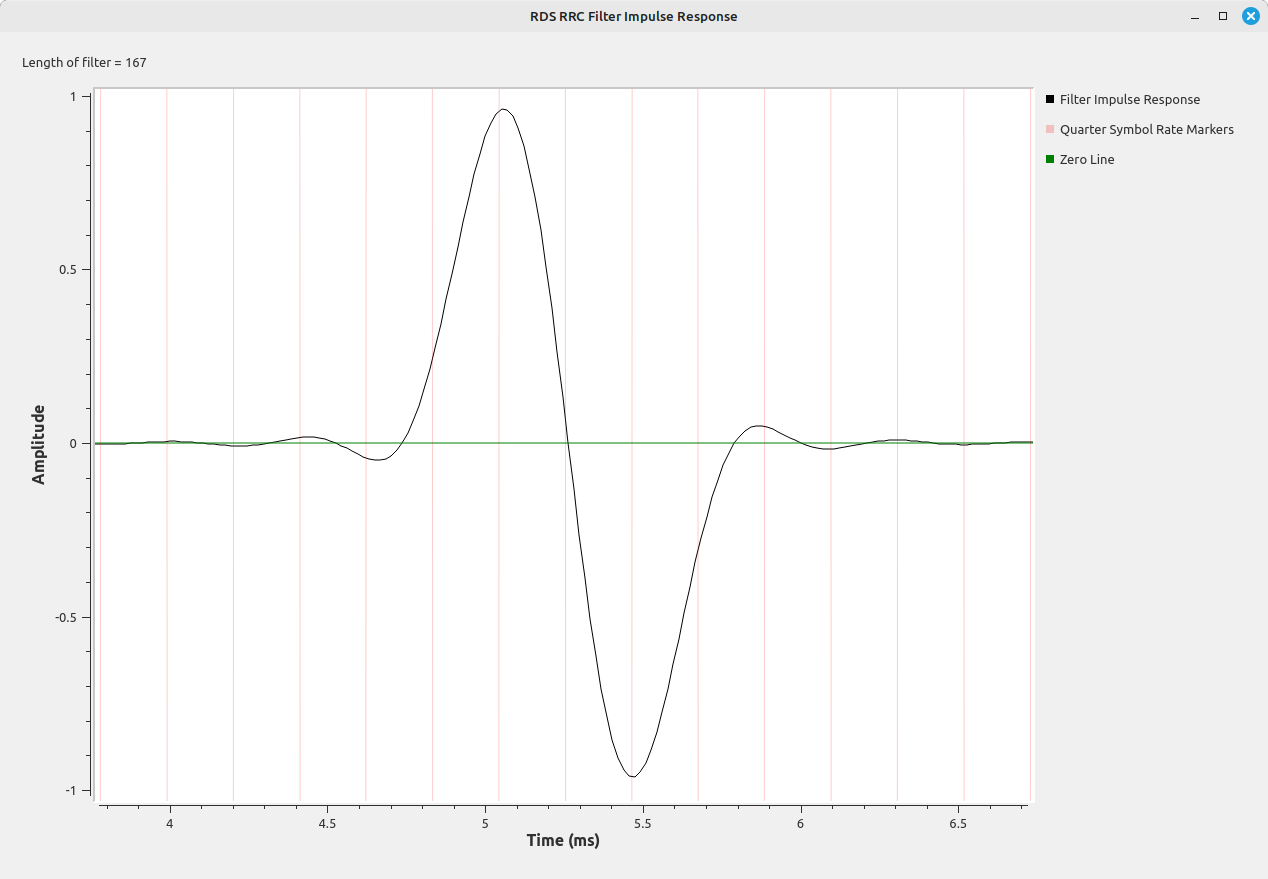
- The impulses are convolved with a filter impulse response that has a spectrum that is essentially a cosine waveform. This creates the final waveform that is modulated onto the 57 kHz carrier using AM with suppressed carrier. As stated in the specification, this is essentially a binary phase shift keyed (BPSK) signal.
While it is not explicitly stated in the specification, the filter is a root raised cosine (RRC). Bastian Bloessl put a RRC filter in his RDS demodulator flowgraph on his Github page. I would like to thank Bastian for the "gr-rds" plugin that makes decoding RDS signals possible, as well as this flowgraph. His flowgraph, with its specific filtering, is the correct filter to use. It matches the RDS waveform perfectly.
A More Basic Way to Create RBDS Signals?
While writing this post, I was trying out different things. One thing I tried was using normal, rectangular pulses with a basic (non-RRC) filter to create the RBDS waveform.
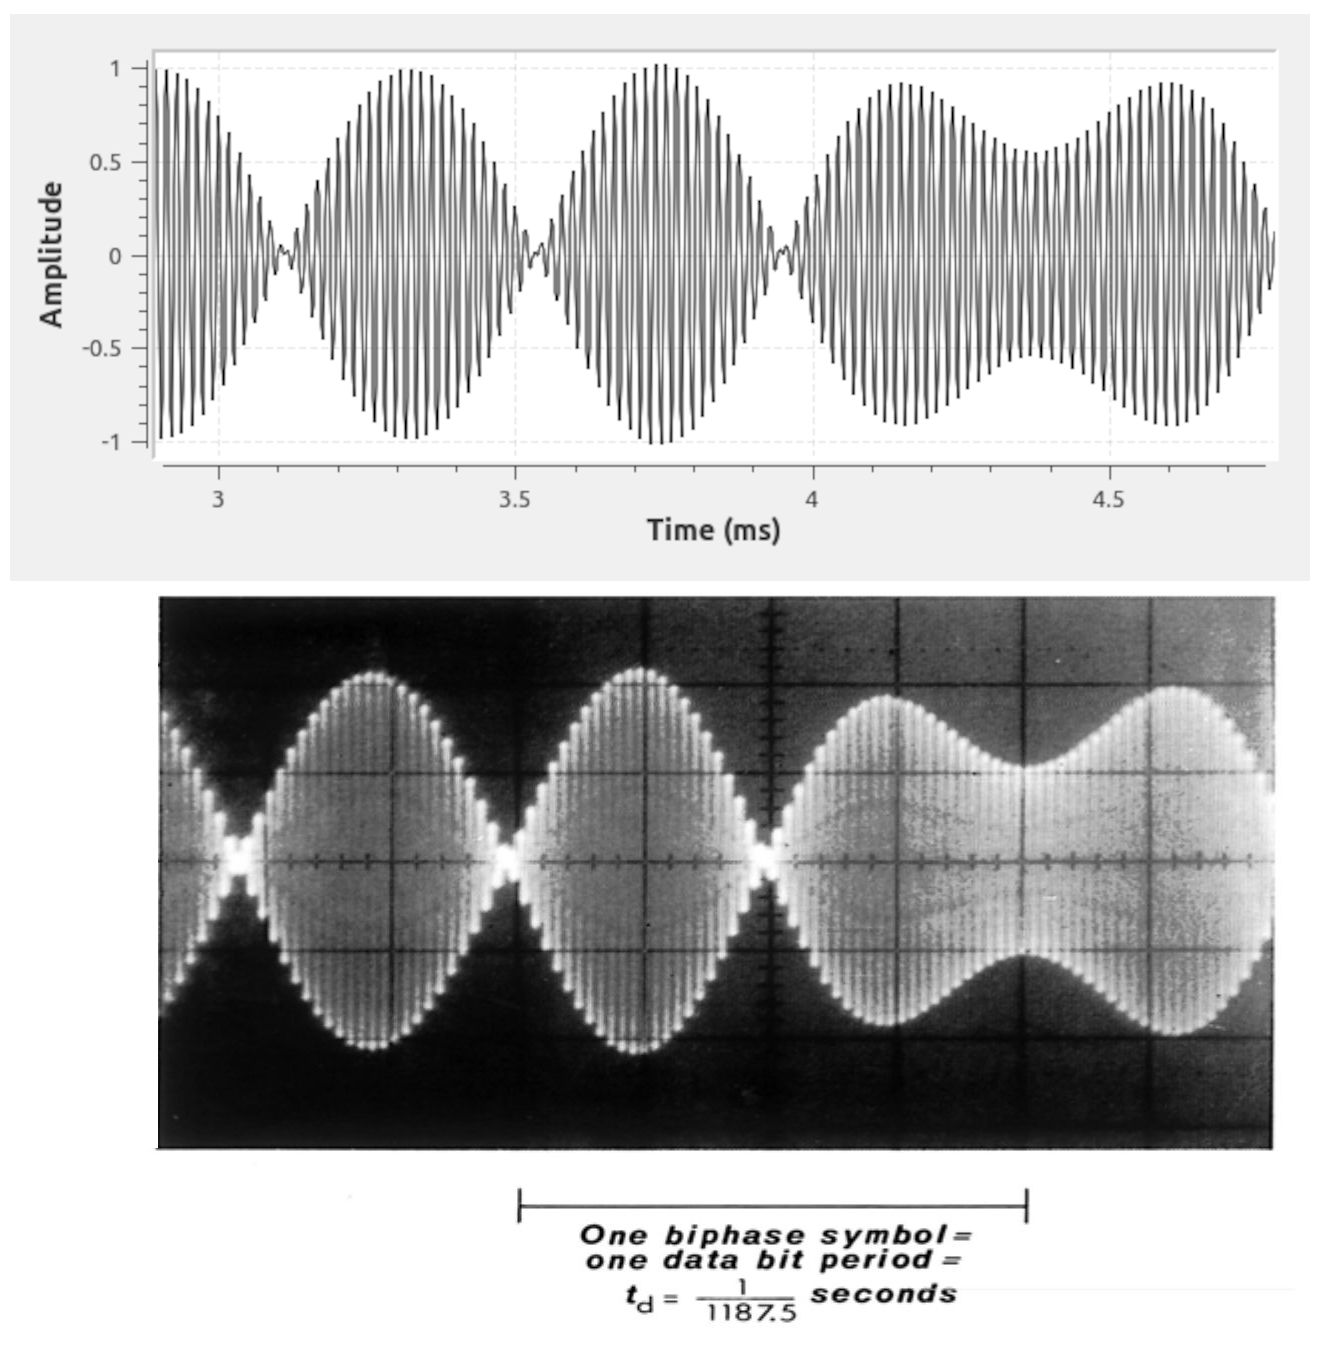
Using a basic windowed-sinc lowpass filter (the "FFT Low Pass Filter" block in Gnu Radio), then modulating the waveform onto a 57 kHz carrier, the waveform looks very similar to the waveform as both stated in the specification and as seen on all RDS-equipped FM stations.
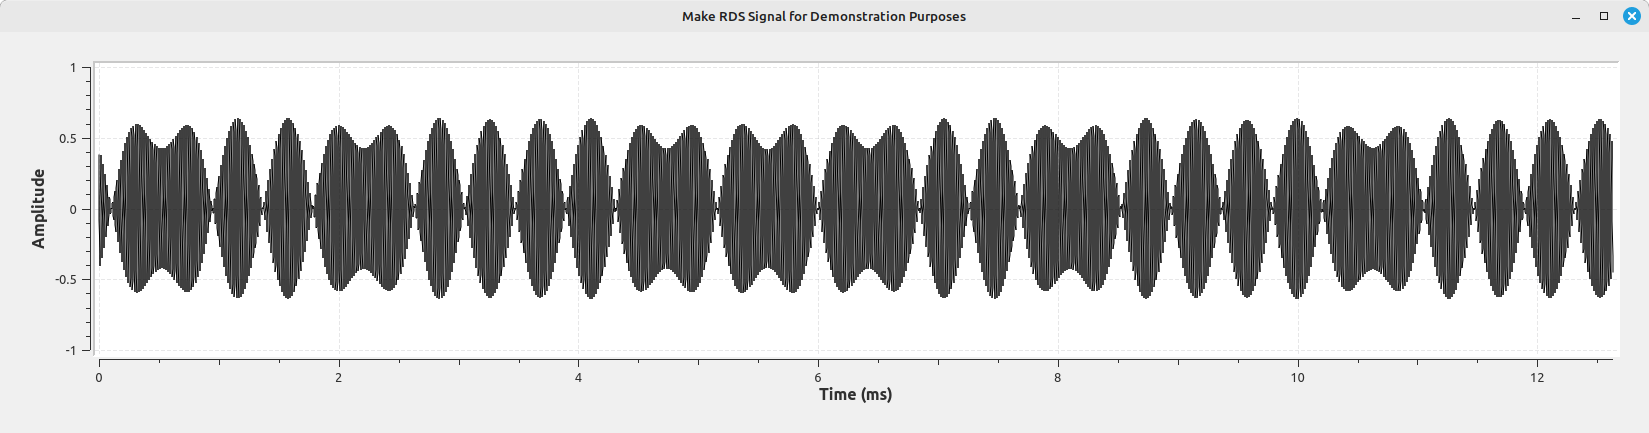
I only find this a curiosity and would be interested to see how it would fare on an actual RDS-equipped receiver.
Are All RDS Signals Equal?
I know you will be shocked when I say that the answer to the question above is, "No." The quality of the RDS signal is generally based on three factors. These are:
- the signal-to-noise ratio (SNR) of the FM signal it is riding on. As the SNR of the FM broadcast signal itself decreases, the SNR of the signals modulated onto it will also see a decrease.
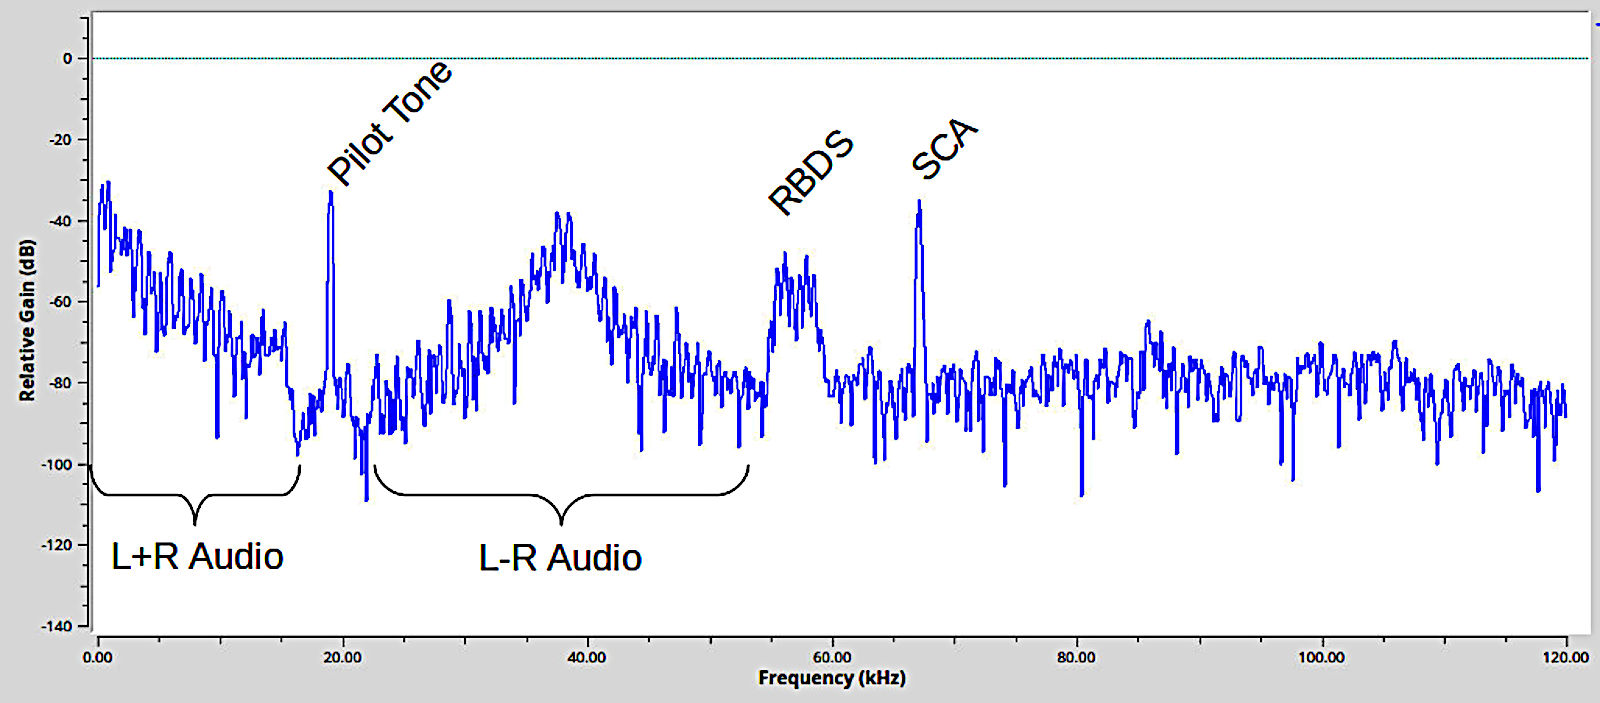
- the level that the broadcaster has set for the RDS signal itself. FM broadcasters have only so much deviation they are allowed to put onto their carrier. In the US, that limit is typically +/-75 kHz. Each signal modulated onto the carrier adds to the deviation. That means they need to share. If it's a stereo signal, this means that the L+R audio, 19 kHz pilot tone, stereo signal (L-R) and RBDS must all add up such that, at maximum deviation, it does not exceed 75 (or 82.5 kHz, in certain circumstances). The FCC also states that the subcarriers, such as RBDS, cannot take up more than a certain percentage of the deviation. For monophonic, for example, subcarriers cannot account for more than 30% of the total deviation. Stereo signals can only use up to 20%. It's up to the station to decide how much of that percentage they want to use, since the rule is "may not exceed". They do not have an "at a minimum" rule, either.
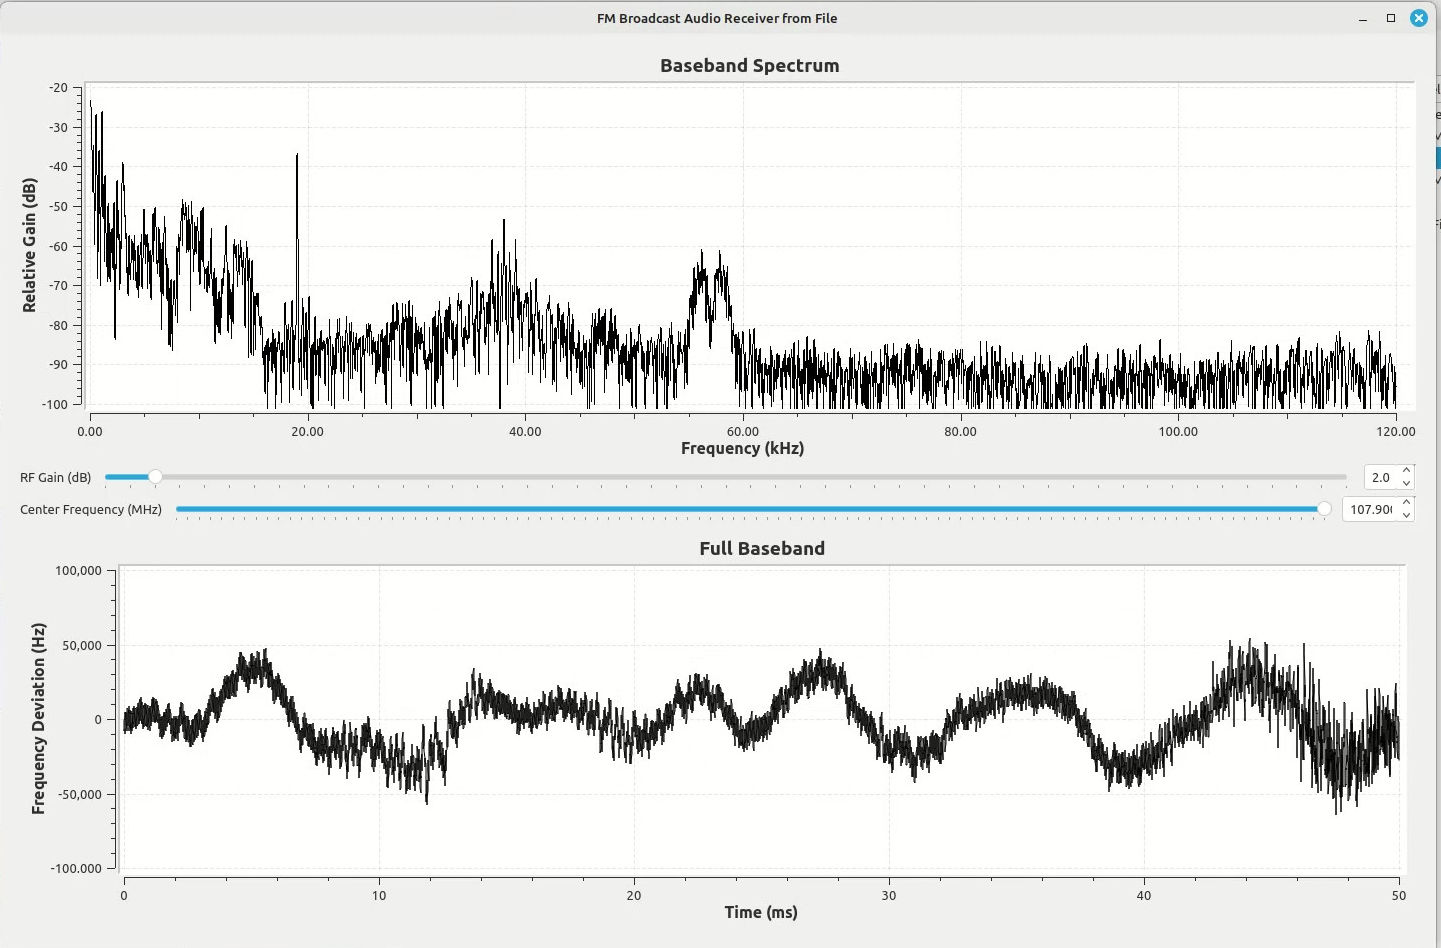
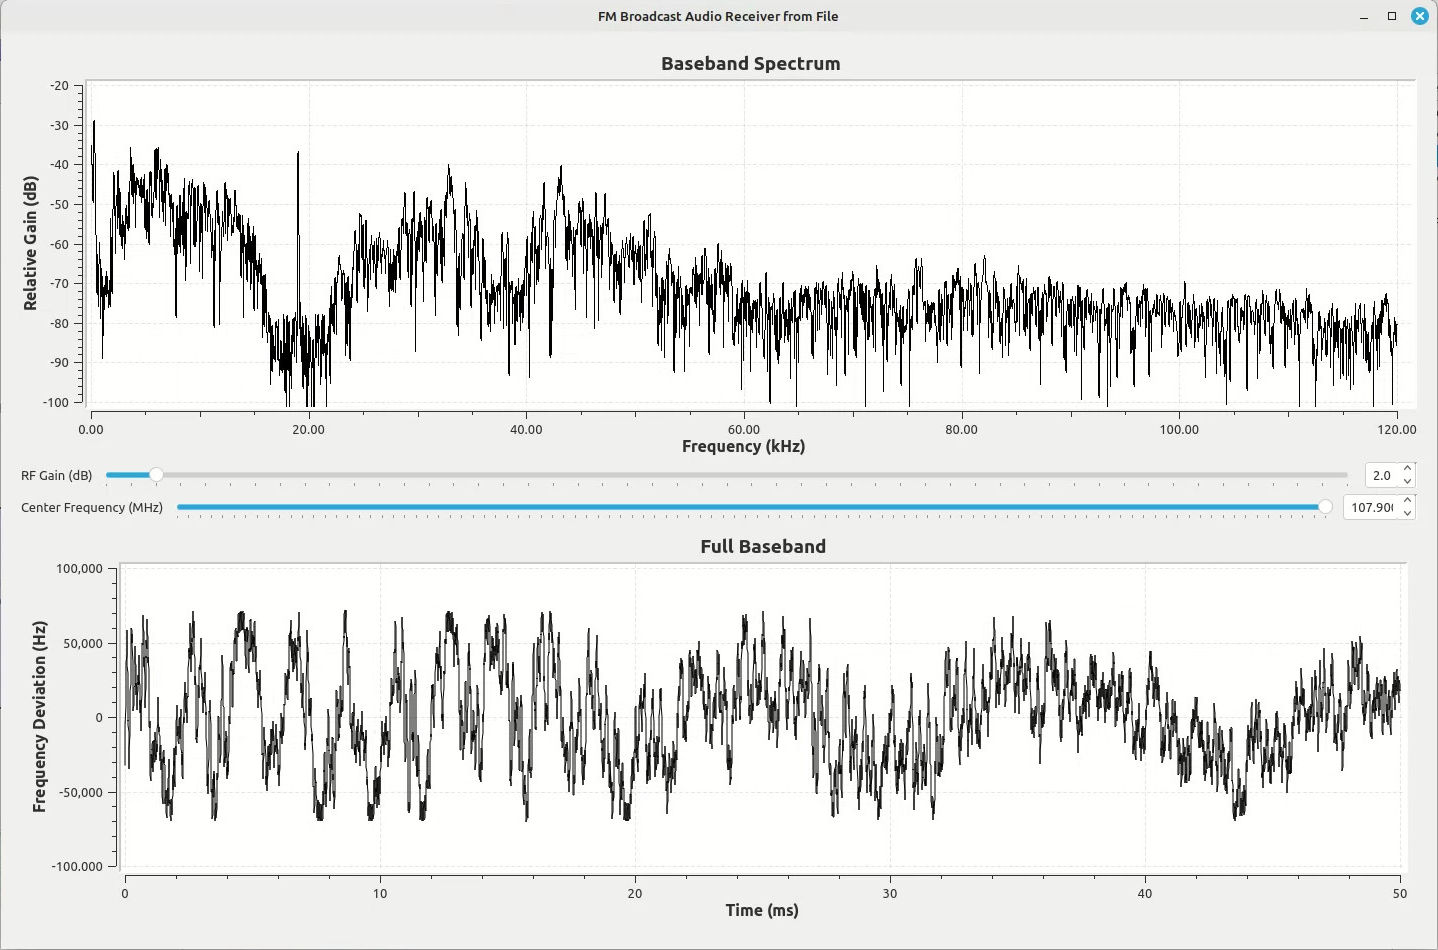
- the noise added due to clipping from the main audio signal as it reaches the limits of deviation. Again, here in the US, the FCC has stated that FM broadcasters can only deviate the carriers so much, normally 75 kHz. They put in place limiters that keep the modulated signal from deviating more than +/-75 kHz (or whatever the limit is, as it may be higher depending on certain circumstances). If the modulating signal is so limited, it's the equivalent of clipping. This is distortion. It causes a jump in the noise floor of the signal. That jump will affect the SNR of any of the baseband signals (main audio, stereo audio, RBDS and other SCAs). This shows up as essentially impulse noise in the signal. During quiet times, the RBDS signal will look perfect. When the audio gets cranked up to the limits, the RBDS may essentially be "washed out".
The point is that not every station will provide a RDS signal that is equally easy to demodulate and decode.
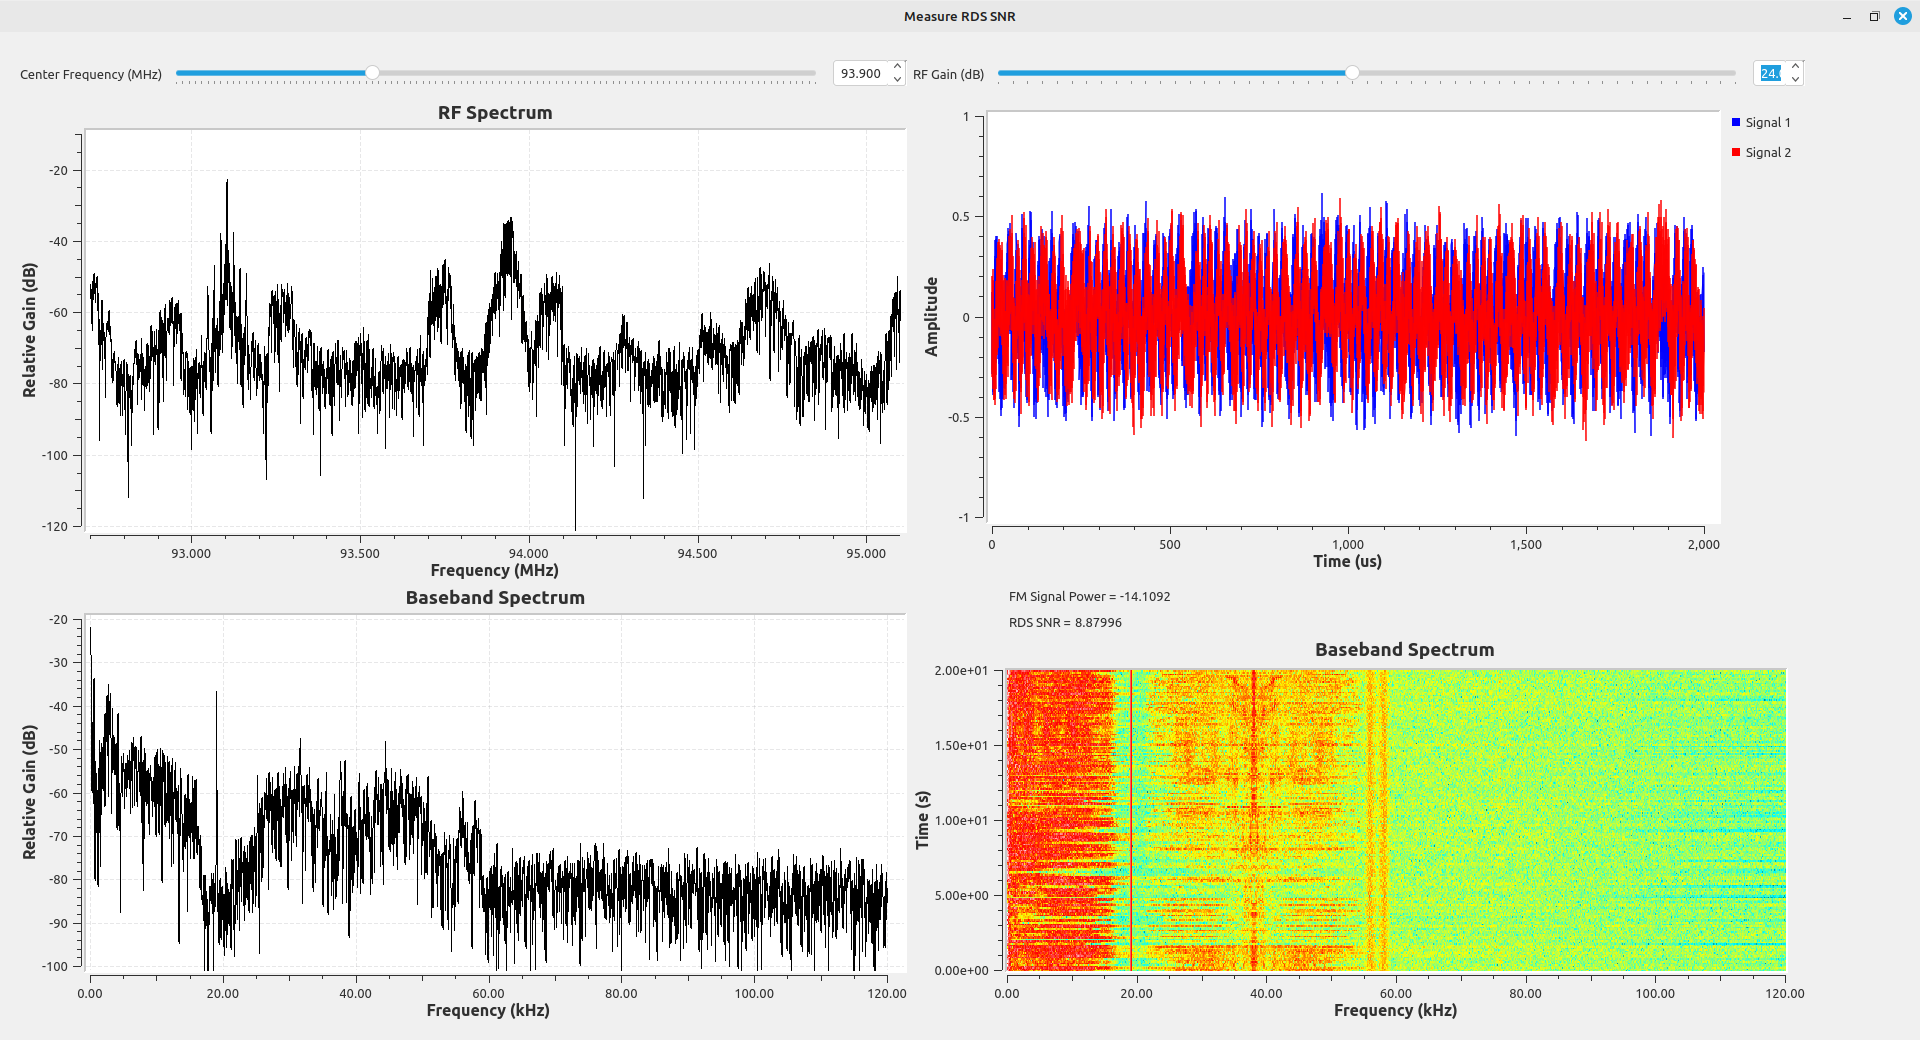
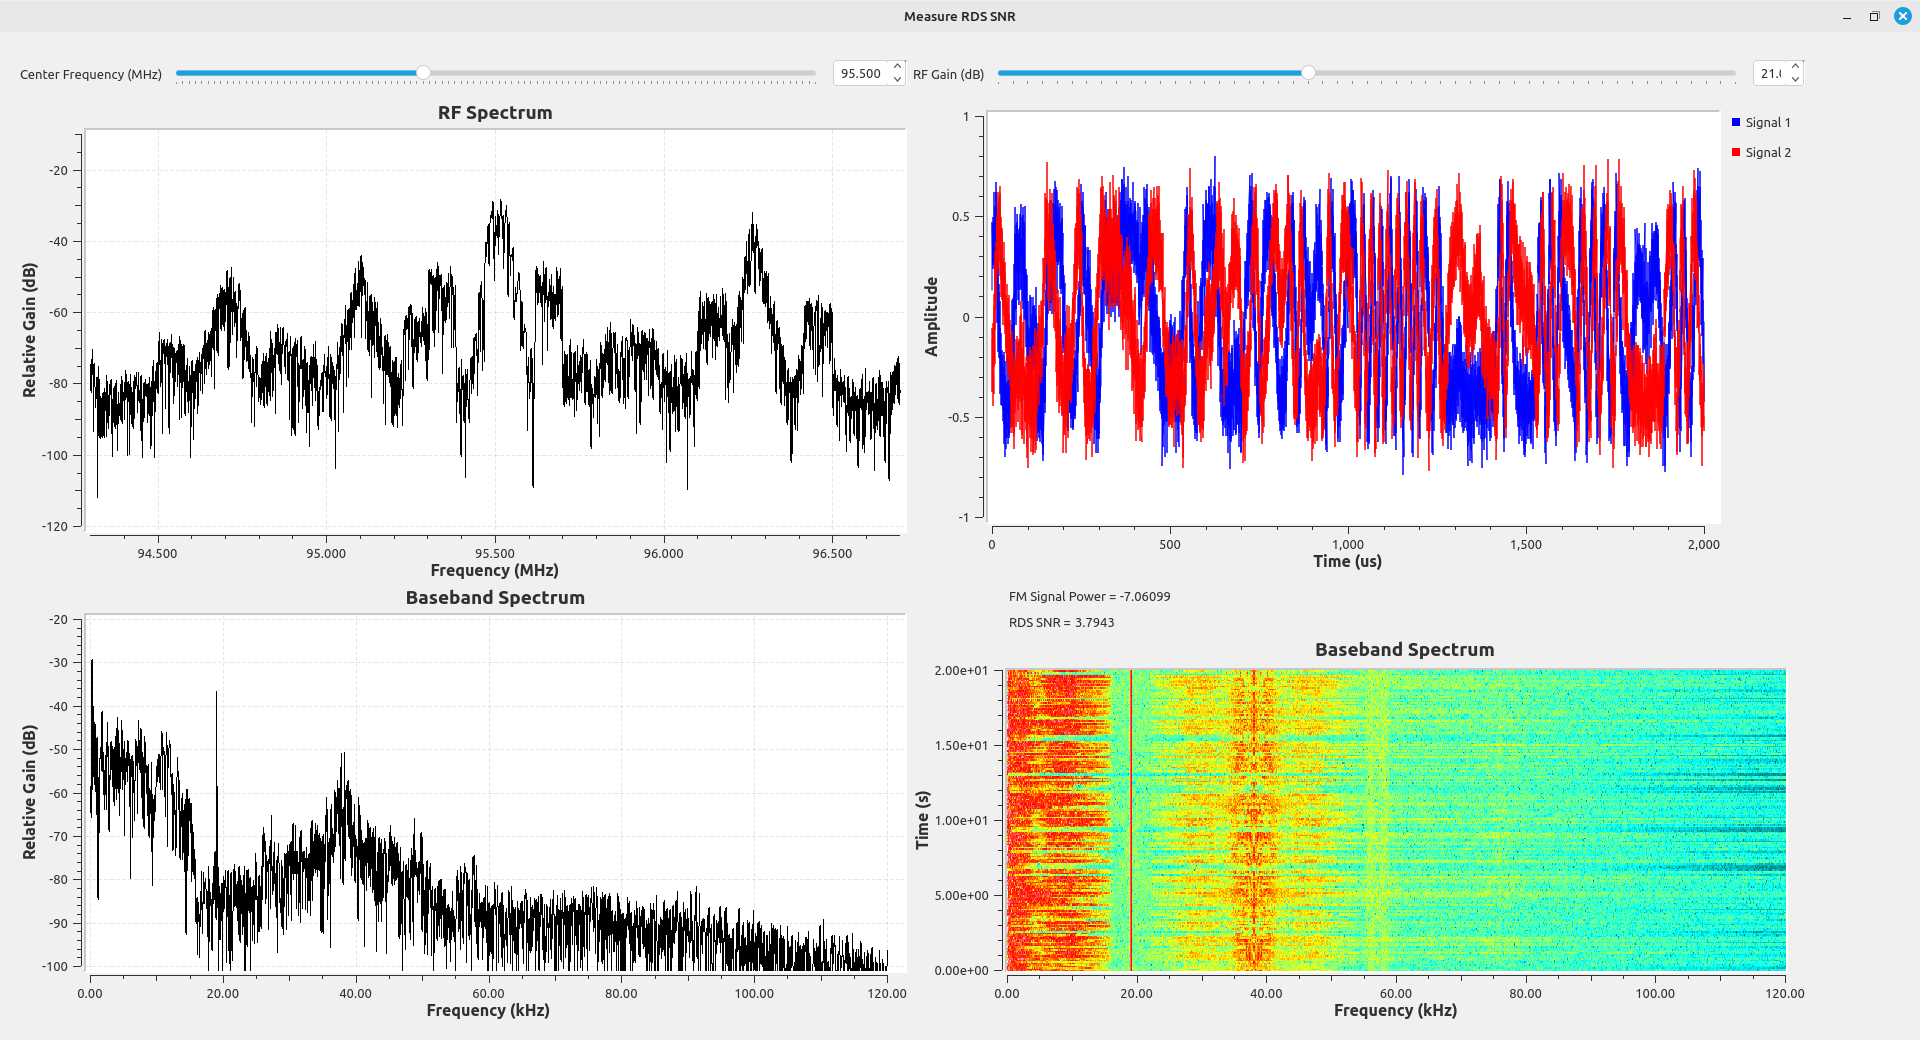
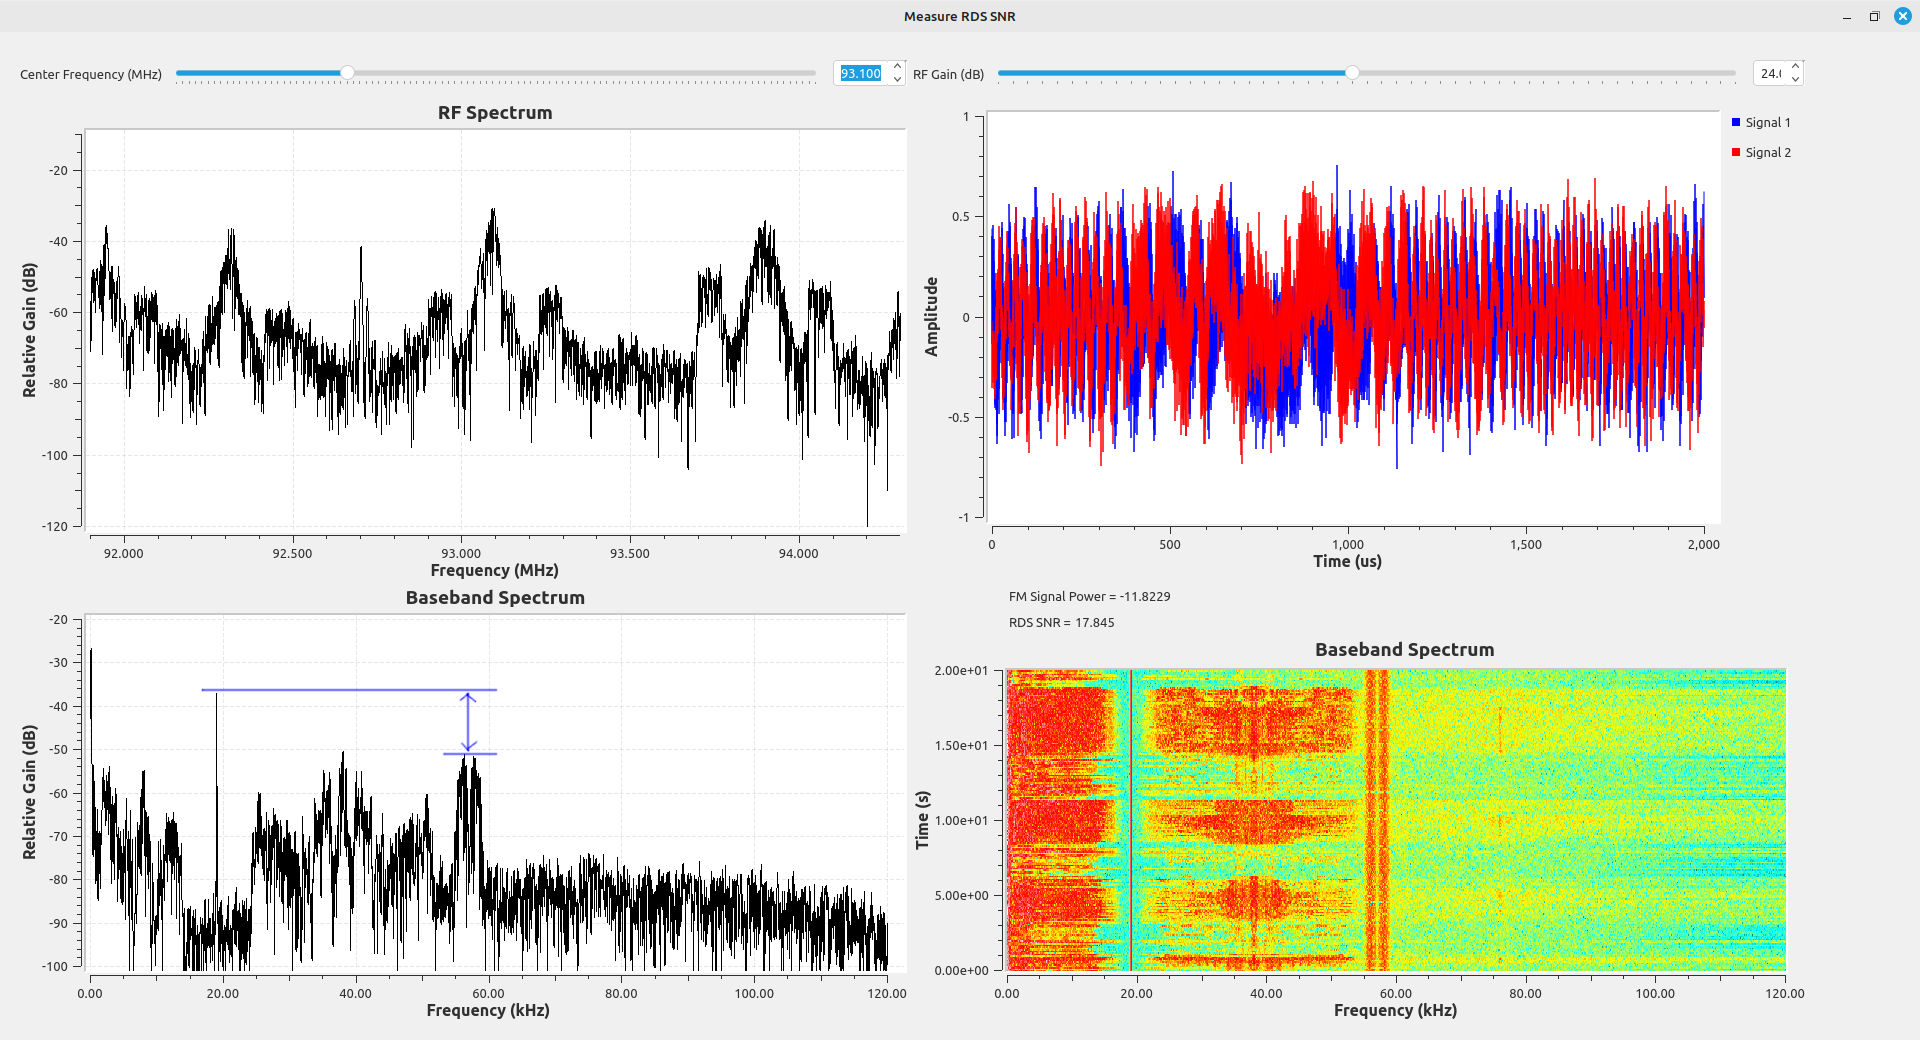
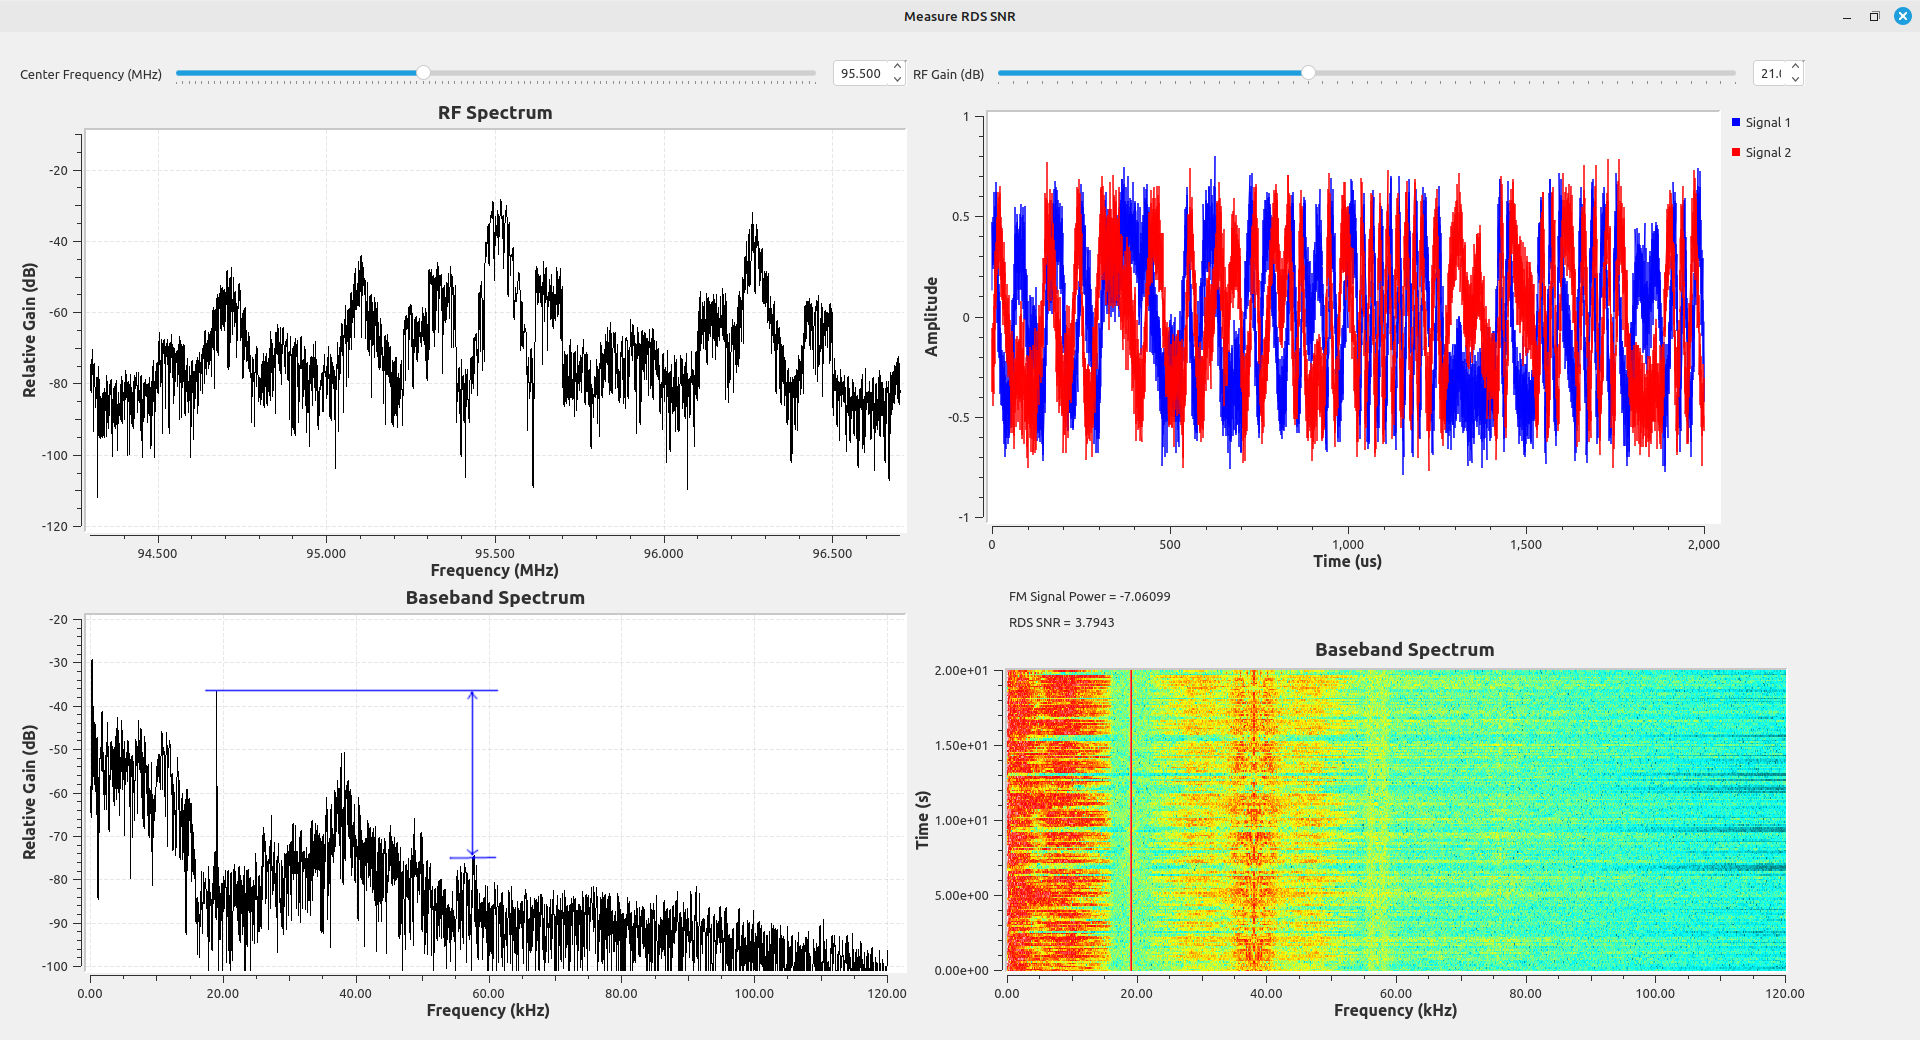
The images below are some examples. Each of these stations have roughly similar signal-to-noise ratios (SNR) for the FM station upon which they ride, yet the RDS signal levels are vastly different.
Testing RDS Signal Levels
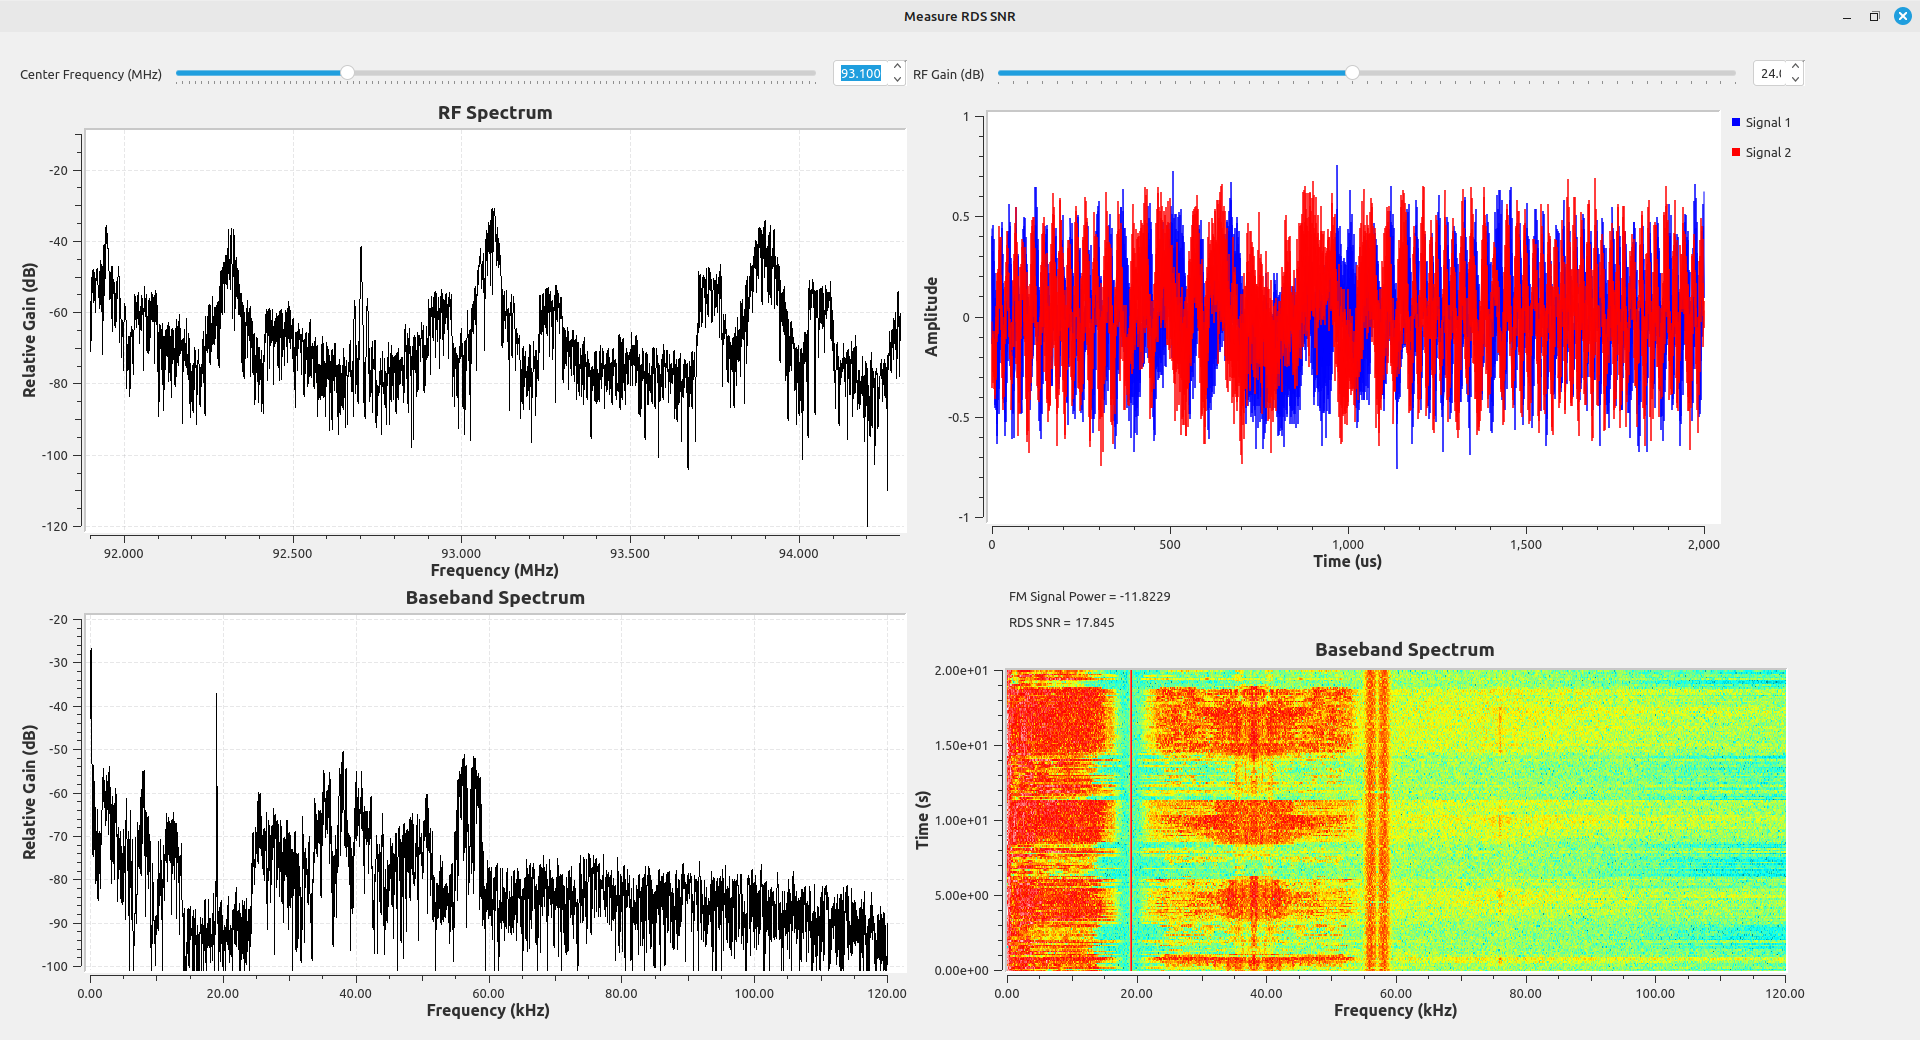
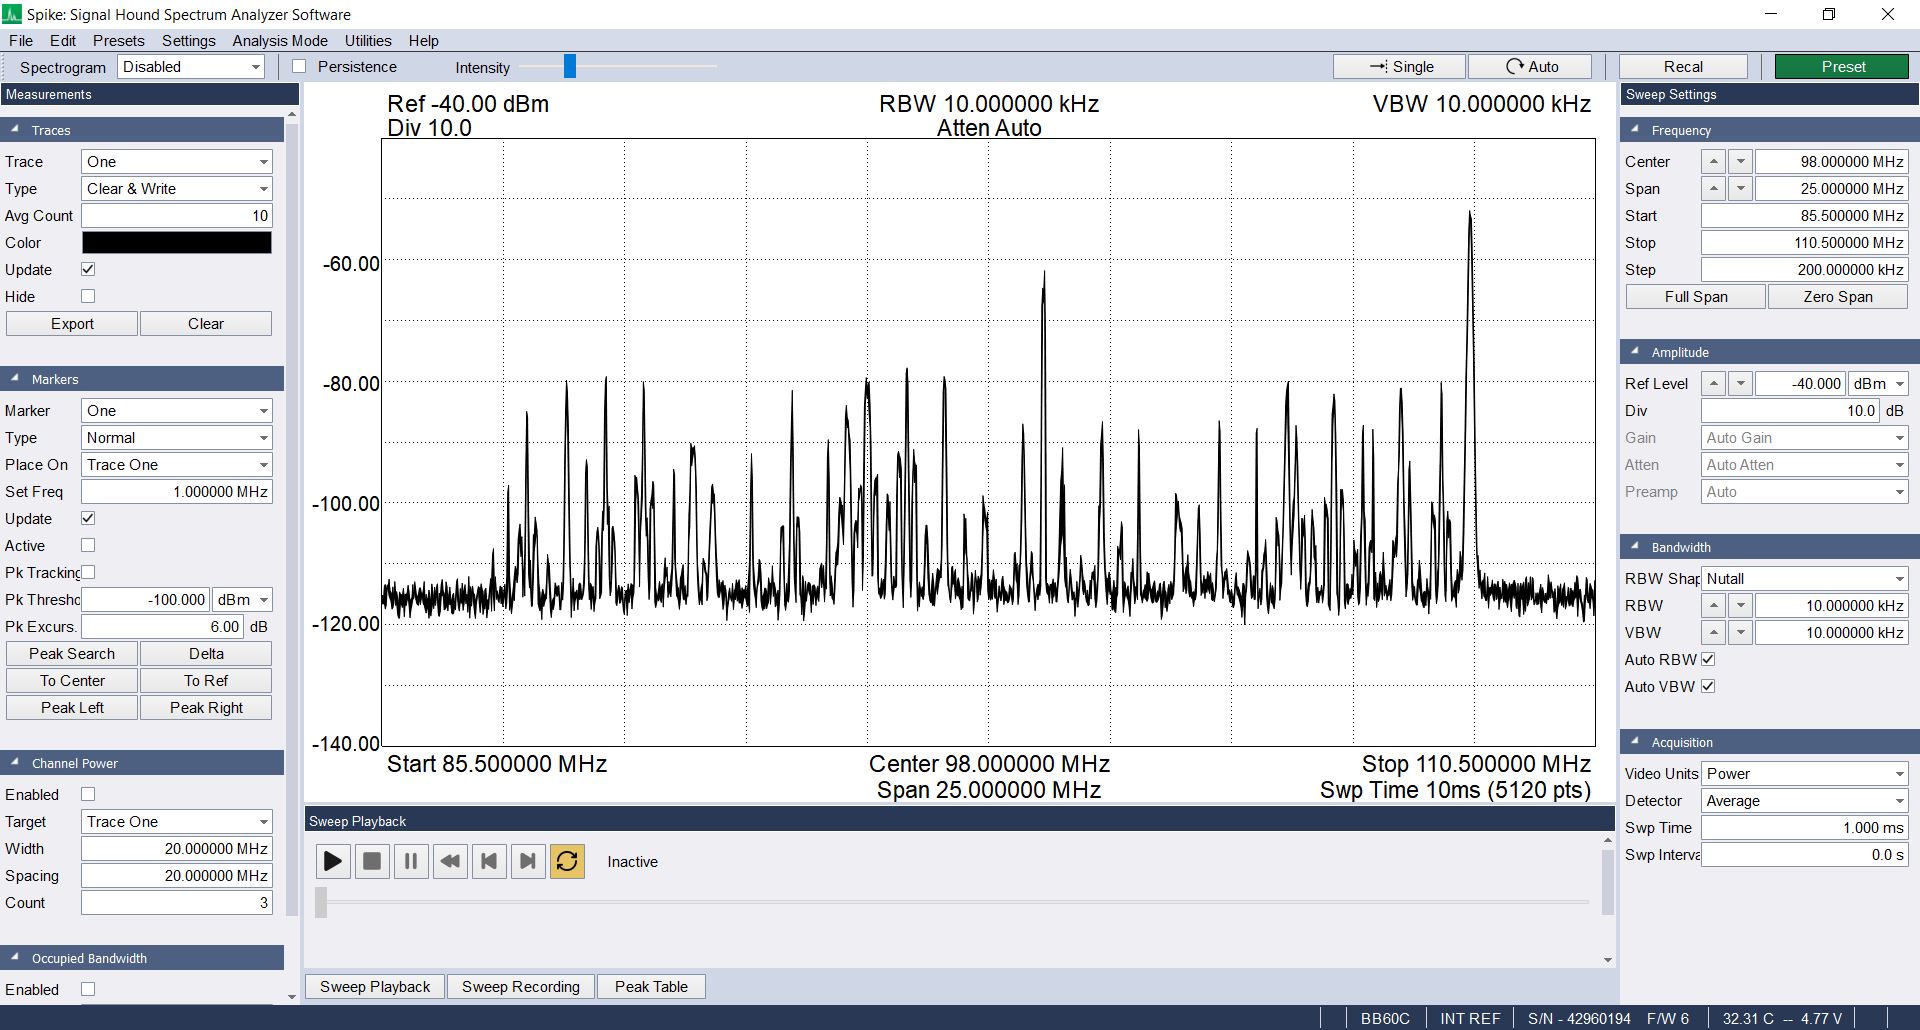
I can receive 38 different FM stations at my house. All of these 38 FM stations have RDS signals. I measured the RDS signal-to-noise ratio (SNR). I also measured the SNR of the FM station upon which it was modulated. I created a flowgraph to measure the SNR of each of these FM stations, as well as the SNR of their respective RDS signals.
I used a basic RTL-SDR (a RTL-SDR.com v3) for this test. I created a flowgraph that measures the signal power both at the FM station, the power of the RDS, and the power in a bandwidth next to the RDS. Even though the RTL-SDR does not provide calibrated signal power levels, it can provide relative power measurements by measuring two signals and calculating the difference.
I connected the RTL-SDR to my antenna. I used the flowgraph to first measure the FM signal power at each station. I adjusted the gain for each signal separately, and I used the time sink at the output of the RTL-SDR to determine the maximum signal level possible at that frequency. I also used the demodulated spectrum to ensure that the gain was not too high. The SDR can saturate at either the RF front end or the digitizer. The time domain display ensures that the digitizer is not saturated. With the RTL-SDR using a 8 bit digitizer, the maximum level occurs when the time sink using complex samples is at the maximum levels of +/-1. If, however, the RF front end is saturated, then the demodulated output will look distorted. It was a balancing act.
Once the gain was set properly, I used the flowgraph to measure the signal level of the FM station, as well as the RDS SNR.
The next step involved remeasuring the power at each FM station, but without the antenna connected. This would provide the noise level. Calculating the difference between the signal level from the first step, and the noise level of this step, provided the signal-to-noise ratio (SNR) for the FM station.
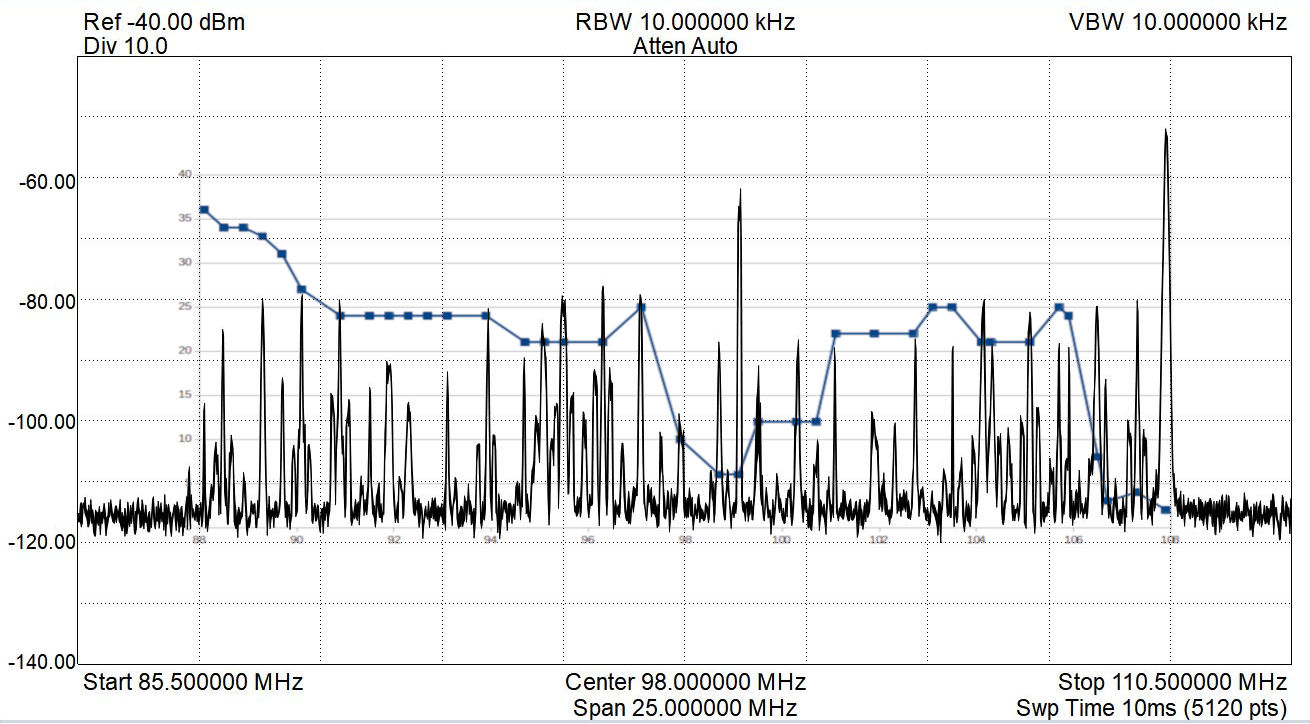
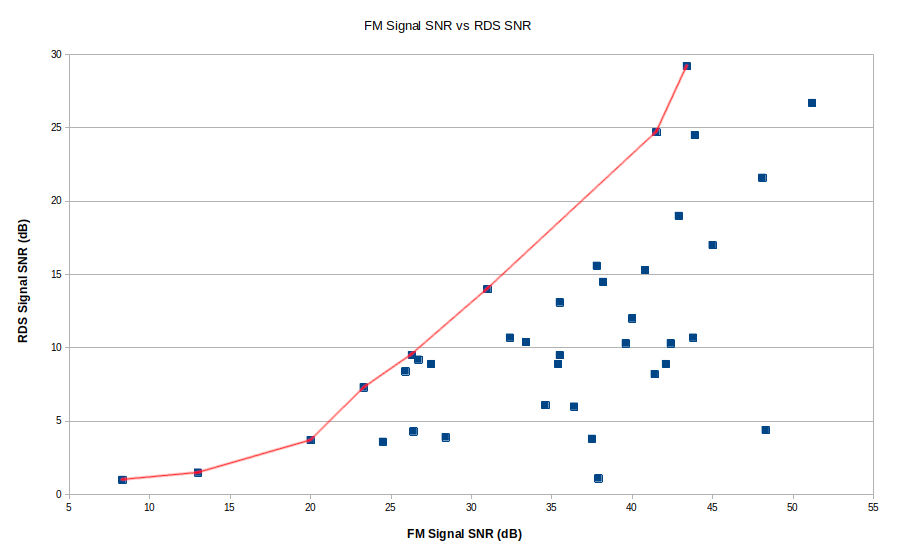
I graphed the FM station signal SNR versus the RDS SNR. The results are quite interesting.
It's possible to get a rough idea of the relative deviation of the RDS signal by comparing it with the level of the 19 kHz pilot tone. Obviously, this only works with stereo signals.
Results
The test results show that the relative deviation provided to the RDS signal and the amount of noise created by distortion of the audio signal play a significant role in the RDS signal quality. Every broadcaster must have different ideas on how much the RDS level is required at the receiver. (I have to think that 95.5 (WPGC), shown above, doesn't care. 48 dB of SNR on the main signal, but the RDS barely registers at around 4 dB SNR? Come on.) It could also depend on what type of information is carried on the RDS signal. For example, I've noticed some stations actually run advertising on their RDS. I'm guessing that they take more care to ensure that the RDS is recoverable by the receivers of its listeners. People paying for advertising don't want to pay for silence.
One last note: I created a Gnu Radio flowgraph to measure the relative deviation created by the RDS signals, but it really only works on strong RDS signals. Otherwise, the noise and interference from the audio signals cause too much amplitude fluctuations to accurately measure the actual deviation just from the RDS signal.
Building a Demodulator
The whole purpose of the digital receiver is to get digital information out of it. Not just any digital information, either. The original digital information, with no (or as few) errors as possible. The great thing is that the RDS waveform is extremely hardy. With some basic circuitry, we can demodulate the carrier and get not only bits, but good bits. Ones that we can put into the RDS decoder and get the proper information back.
Basic Sections of a RDS Demodulator
Regardless of the specific details, here are the basic sections you'll find in any RDS decoder:
- Frequency Downconverter: Once the FM station is demodulated to give you the composite baseband signal, you need to shift the 57 kHz RDS signal down to baseband. This can be done in one of two ways. The first is to simply generate your own 57 kHz signal and mix it with the RDS signal. This has the advantage of working on any FM station, whether stereo or monophonic. The second way is to use the 19 kHz pilot tone, triple it to create a 3rd harmonic, and mix that with the RDS signal. The advantage of this is that it tends to work better, in my opinion, then self-generated oscillators. But it comes with the drawback that it only works on stereo signals.
- Filter: With the signal at baseband, it needs to be filtered. My circuit uses the root raised cosine (RRC) filter as used in Bastian Bloessl's RDS flowgraph. This is a matched filter, as it matches the original waveform.
- Symbol Sync: You need to pick the correct point on the waveform to recover the original bitstream properly. The symbol sync is what chooses that correct point. There are several possible choices for selecting the correct symbol point. Most symbol sync circuits create an "error signal". The smaller the error signal (meaning the closer it is to zero), the better. The best options are those in which the error signal is 0. The detectors are typically called "timing error detectors" (TED). Bastian Bloessl's flowgraph uses a "zero crossing" TED. I'll demonstrate the "y[n]y'[n] maximum likelihood" TED.
- Demodulator: Once you have the correct point to use, create the actual bits based on the position of the symbol.
Downconversion
There are two methods to obtain the local oscillator used to downconvert the RDS signal. These are:
- Use the 19 kHz pilot tone and triple it (literally multiply it by itself three times). This requires that the station be a stereo FM station, not monophonic.
- Create the oscillator locally using the "best guess" to get as close as possible to 57 kHz. This is the only method possible if there is no stereo pilot tone.
Downconverting Using the Stereo Pilot Tone
The only copy of the RDS spec that I have is NRSC-4, which is dated from 2005. Anyway, that version stated:
During stereo broadcasts the subcarrier frequency will be locked to the third harmonic of the 19-kHz pilot- tone.
If this is true, then using the 3rd harmonic of the 19 kHz pilot tone should provide a oscillator that is already locked to the RDS signal. I have no idea if this is still true. The standard is now controlled by the International Electrotechnical Commission (IEC). I don't feel like shelling out the 185 Swiss francs (roughly $214 USD) for it. Instead, I've created a flowgraph that uses the 19 kHz pilot tone to demodulate the RDS signal.
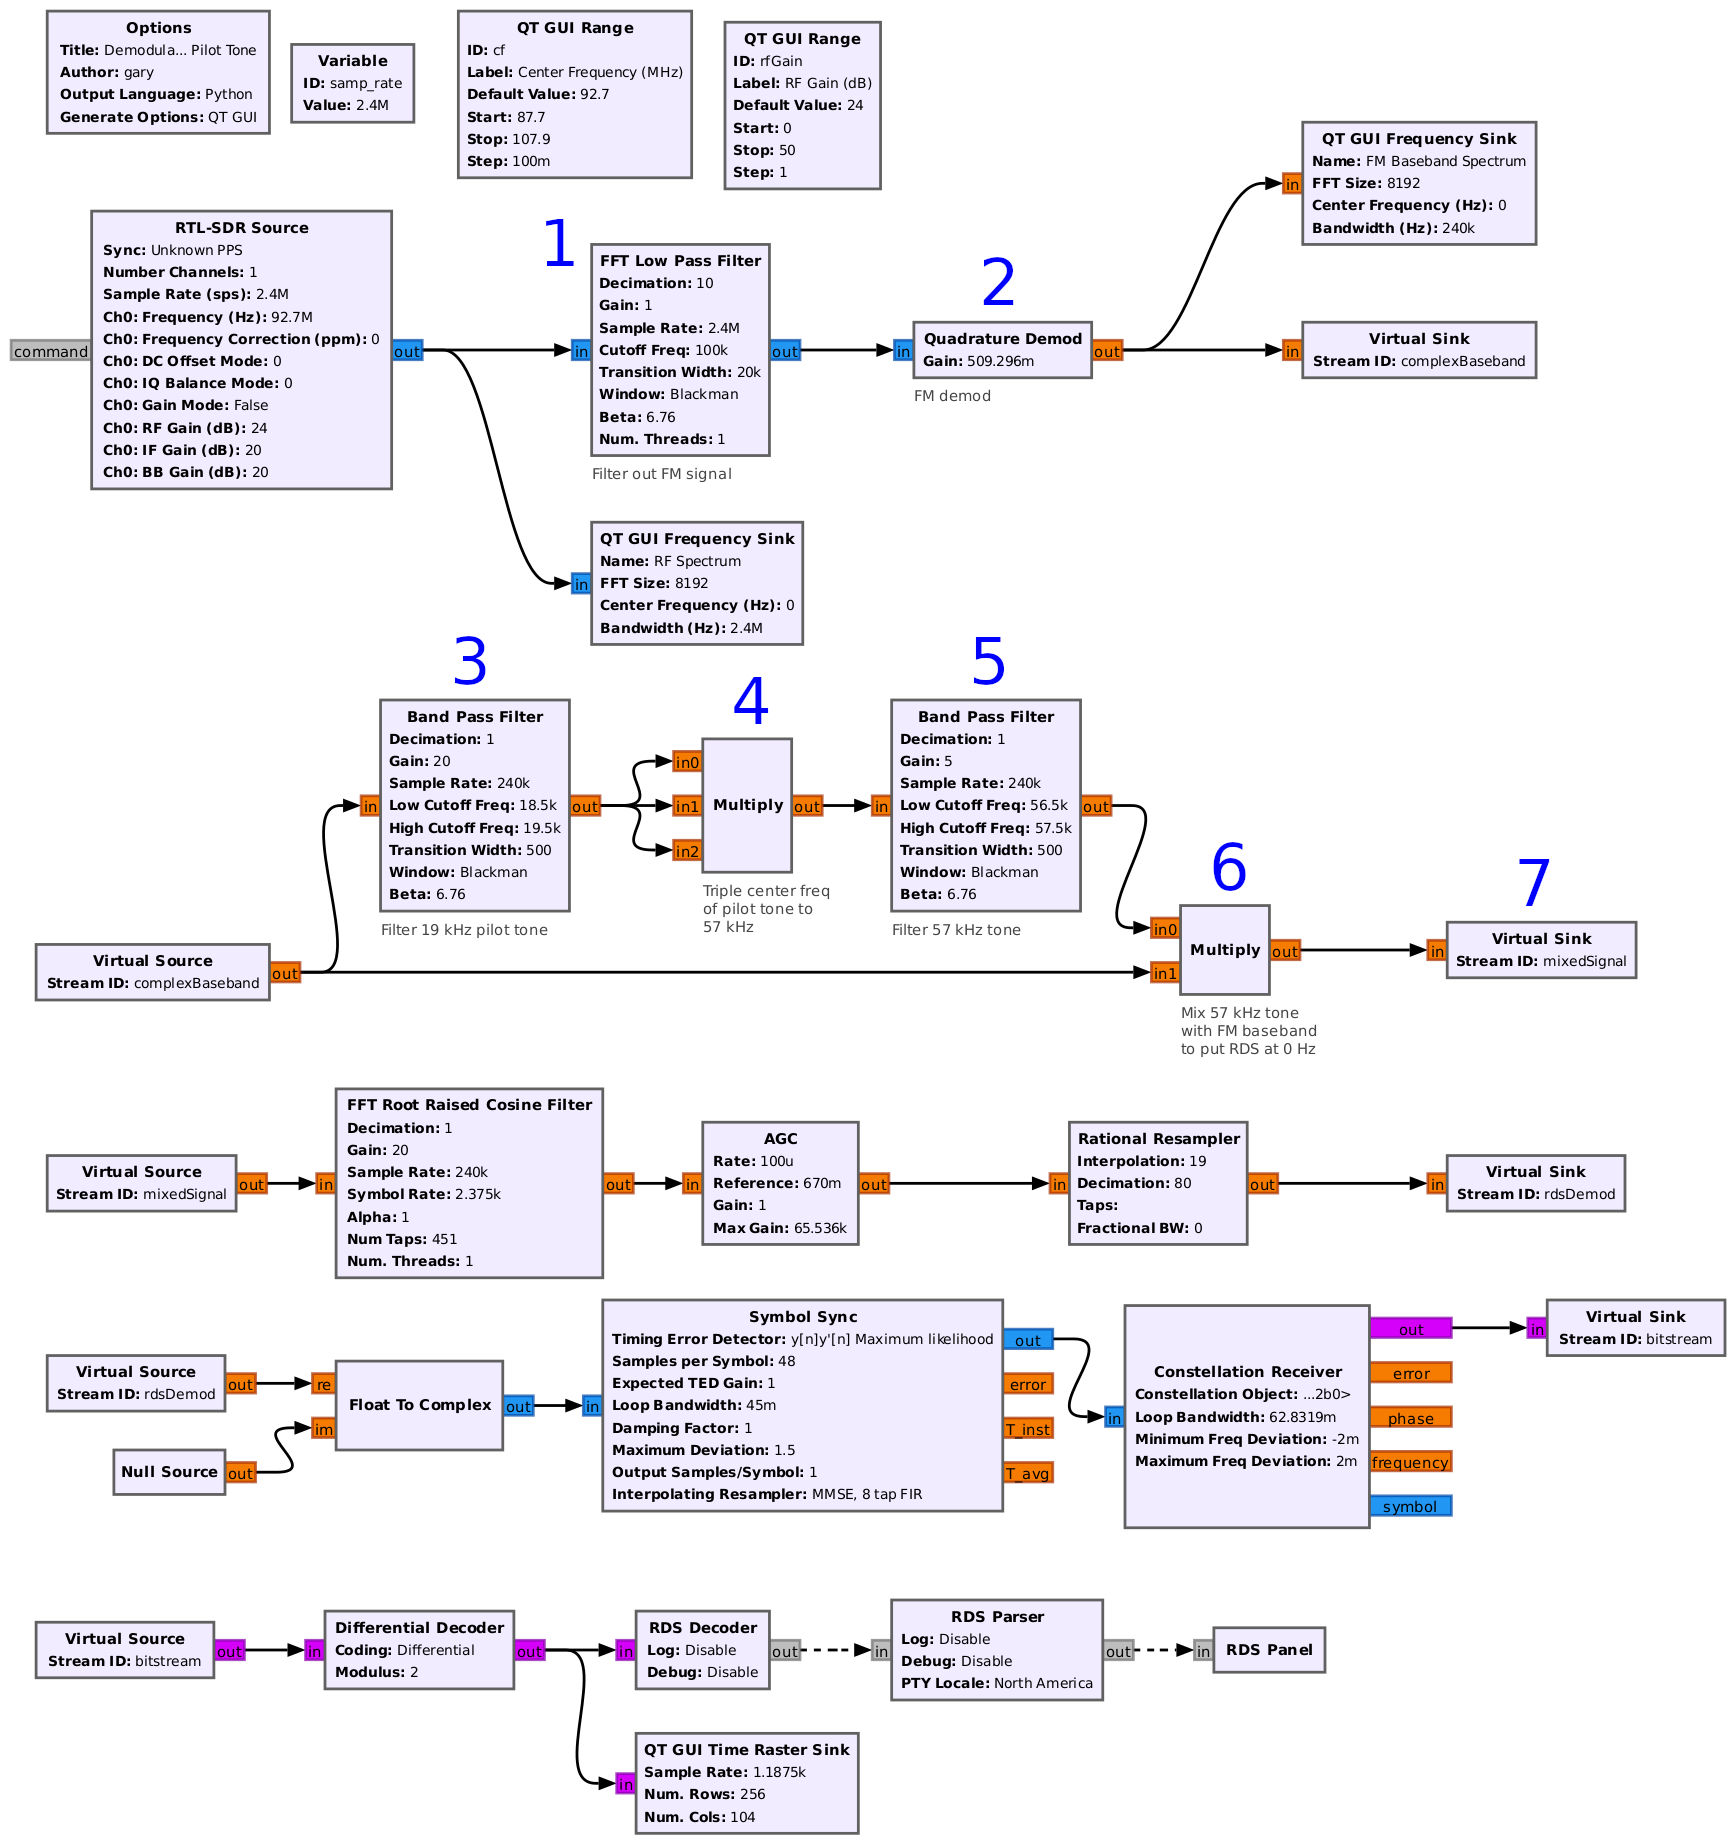
- This lowpass filter removes everything except for the analog FM signal.
- The "Quad Demod" block frequency demodulates the signal.
- This block filters out the 19 kHz pilot tone.
- This block calculates the third harmonic (hence three inputs).
- This block filters out the 57 kHz tone created by tripling the 19 kHz pilot.
- The third harmonic is multiplied against the original baseband signal, shifting the 57 kHz signal up to 0 Hz.
- The signal is sent on to be filtered, synced, and decoded.
I scanned through all 33 FM stereo stations that I can successfully receive in my area. Very few showed a good decoding. Most had a lot of errors. It's probable that my flowgraph needs tweaking. But, regardless, given the inability to handle non-stereo signals (which make up a significant fraction of all of the FM stations), I'll stick to a local oscillator.
Long story short: Out of 33 stereo stations I can recover, only 10 (less than a third) have synchronization between the pilot and RDS. This is just over a quarter of all FM stations (38) I can successfully recover. Frankly, this was one of the worst flowgraphs I tried.
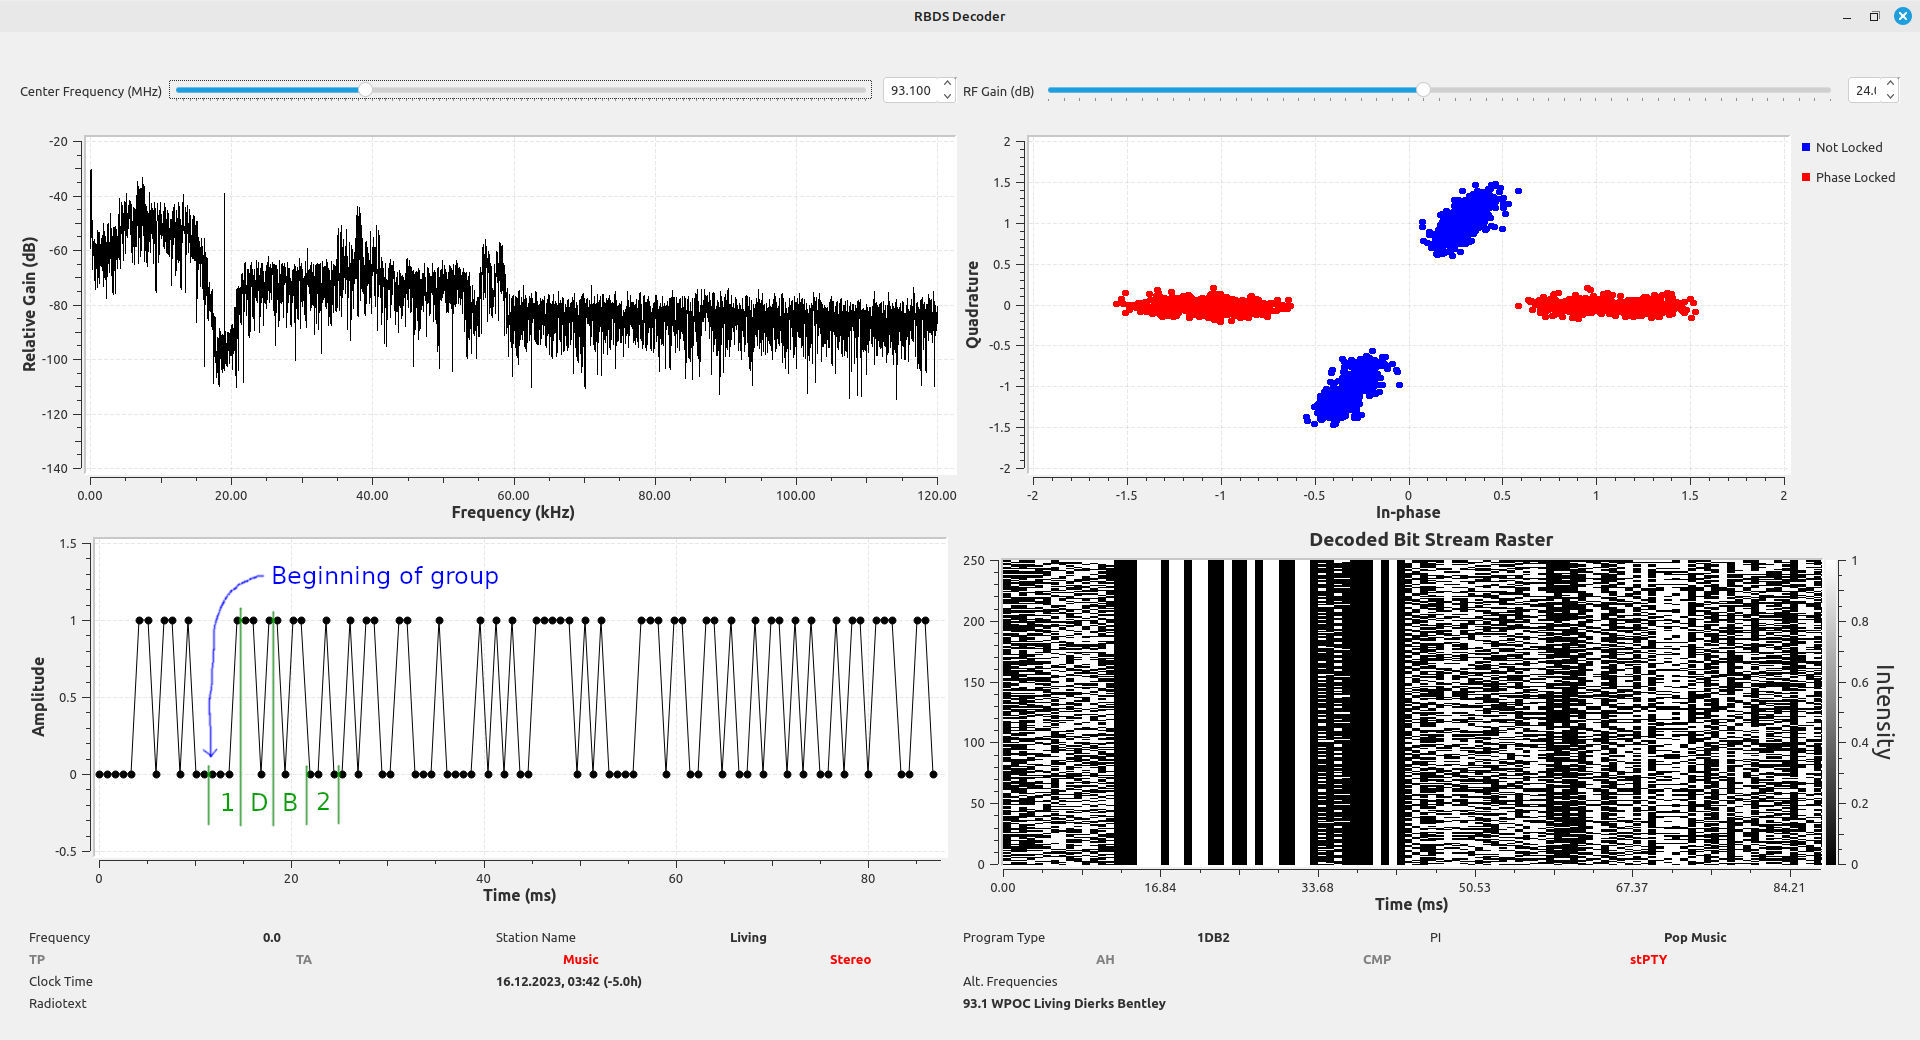
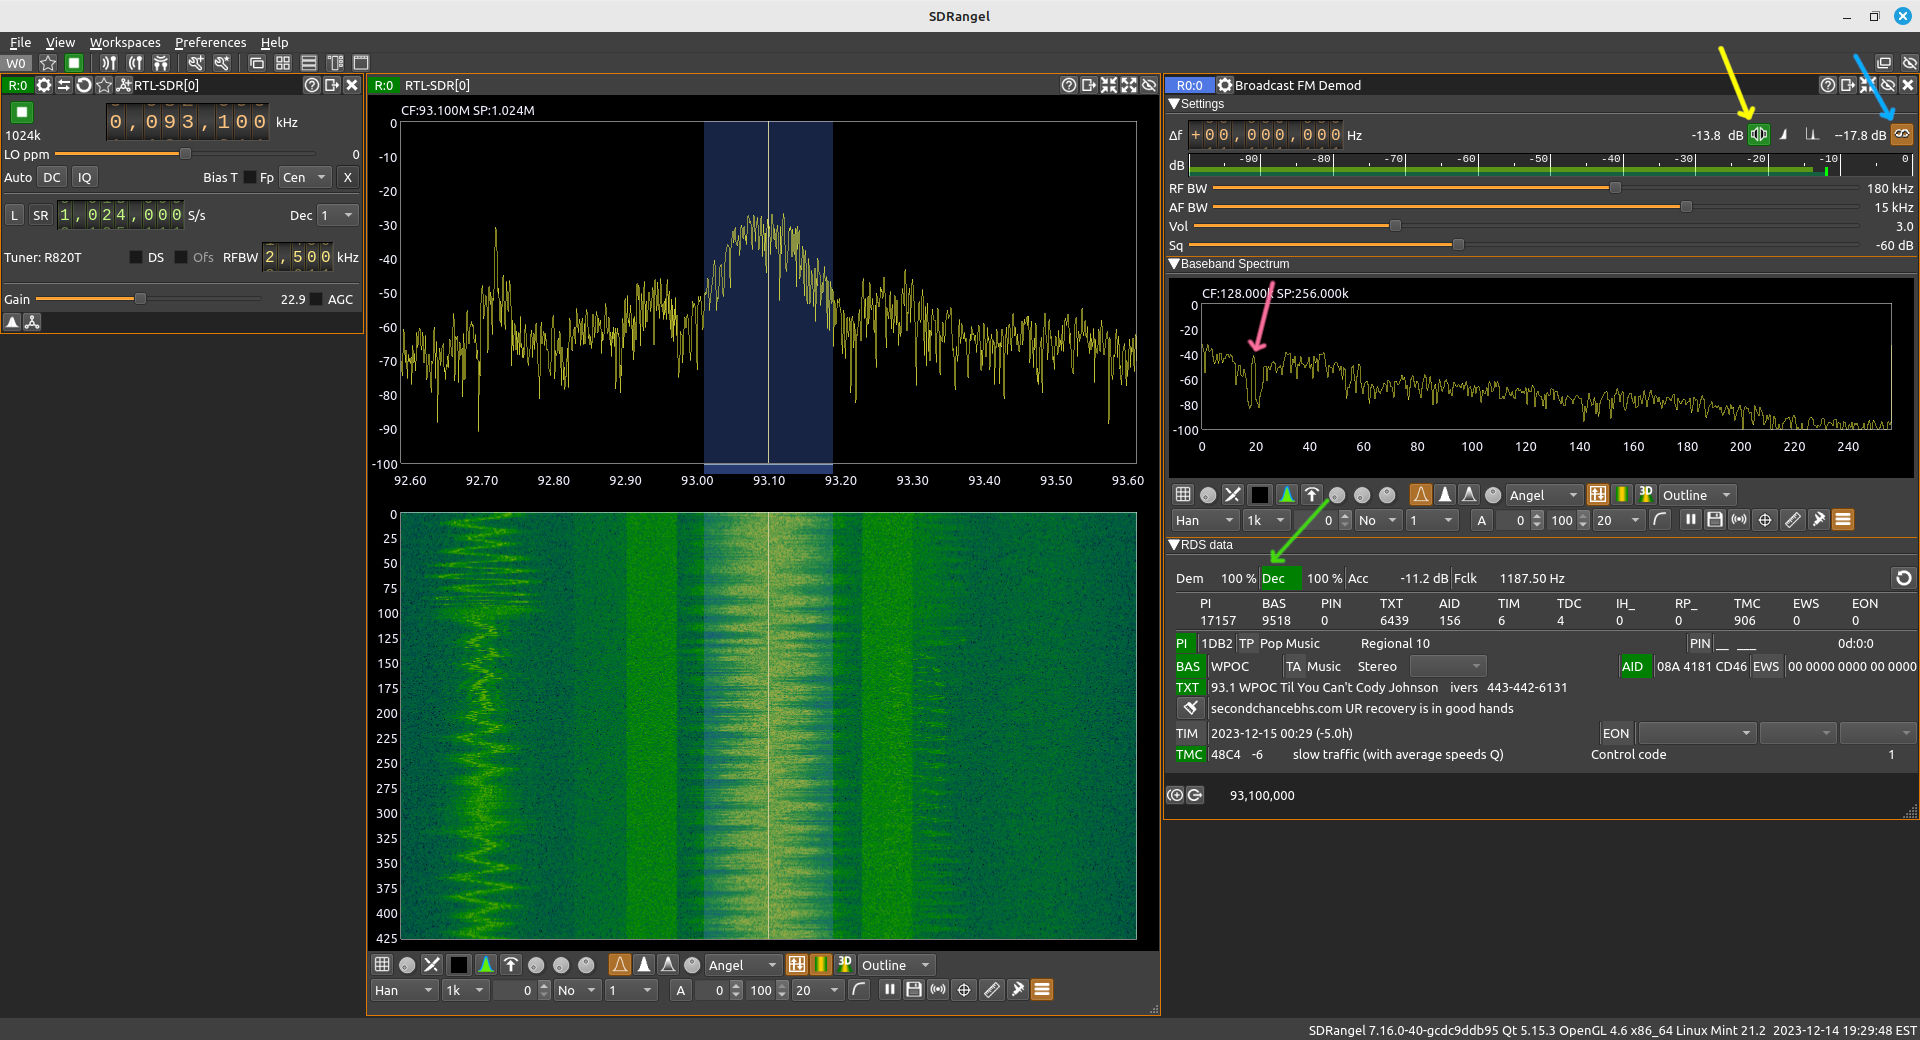
SDRangel and RDS Decoding
Yes, SDRangel. I've covered SDRangel in some detail. The one thing that I did not cover was how to make it decode RDS signals. It's discussed in the figure below. I'm including it here because SDRangel demodulates and decodes RDS information using the 19 kHz pilot tone. I have 38 FM stations I can demodulate and get audio. Of those, 33 are stereo. That means there are 5 stations from which SDRangel cannot recover the RDS information. No stereo pilot tone, no RDS. (NOTE: I've also discovered that if the sample rate is too low (for example, I tried at 256 kSam/s), the RDS decoder will not work.) Out of the 38 stations total, I can only recover RDS information reliably from 18 stations, with another 8 stations providing RDS information with a lot of errors. The rest provided no information at all.
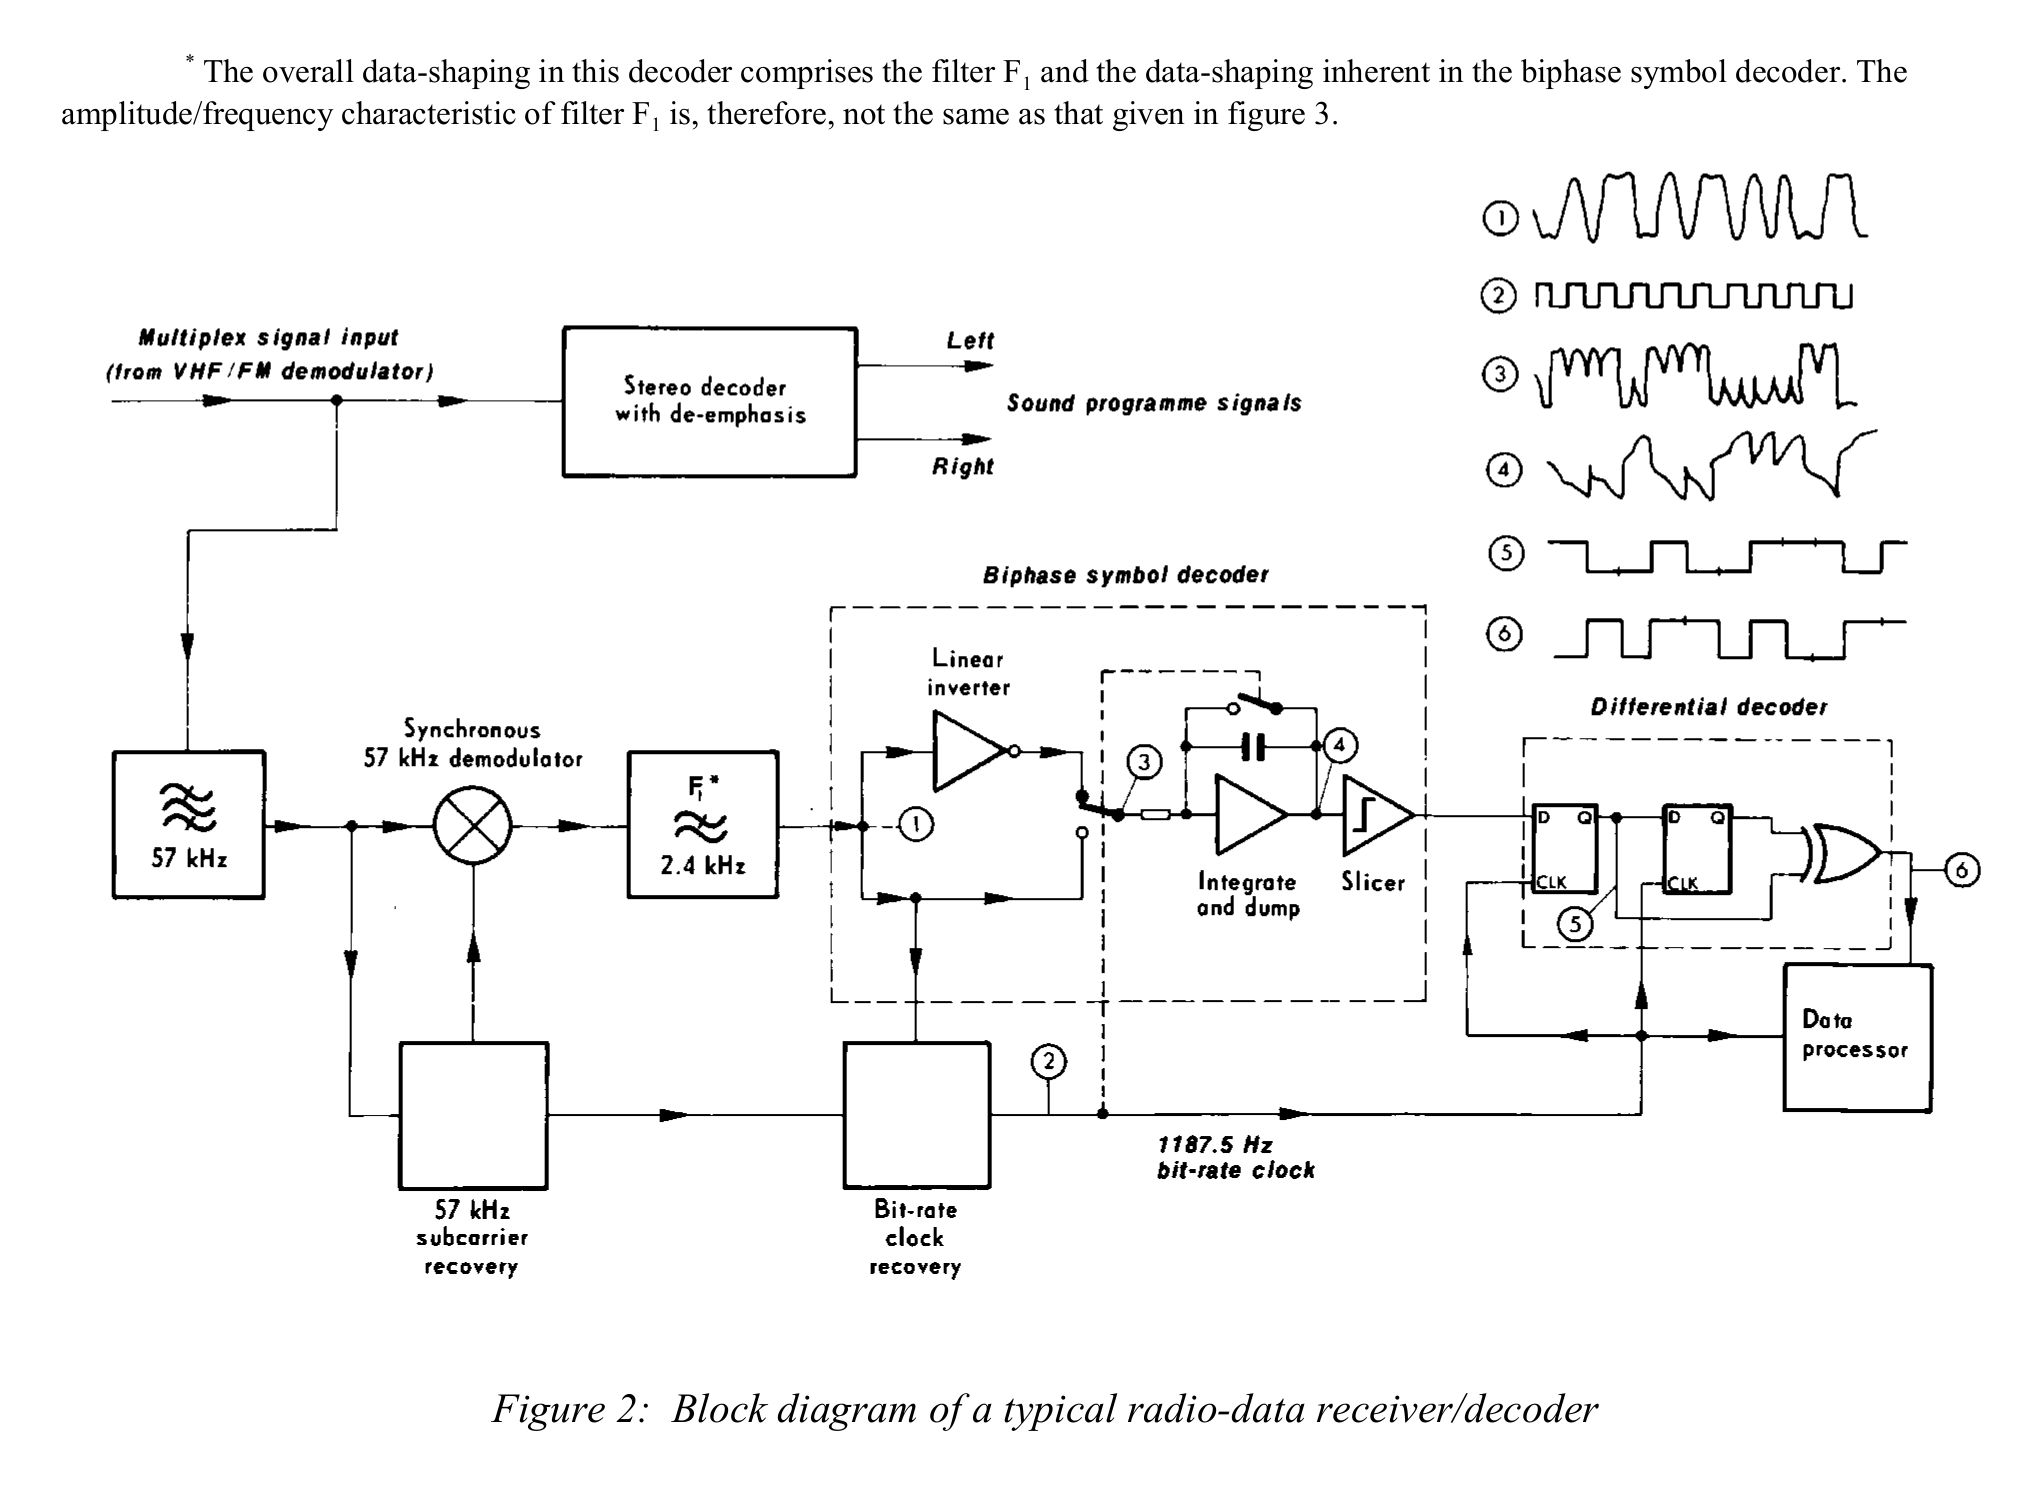
The NRSC-Specified Receiver
The NRSC, along with specifying a transmitter circuit, also provided a suggested receiver. It has two parts that make it unusable for GRC. These are:
- synchronizing with the Manchester-encoded symbols, and multiplying with another signal to essentially remove the encoding. This is done by multiplying the Manchester-encoded signal with a square wave that runs at the symbol rate of 2375 Hz. This creates symbols at the original bit rate of 1187.5 Hz. GRC does not have this capability. Yes, you can create a square wave and multiply it with the signal. The problem is you have to synchronize it with the signal. There's no way (of which I'm aware) to do so in GRC currently.
- demodulating the signal using an "integrate-and-dump" circuit. GRC does not have an "integrate-and-dump" circuit (again, of which I'm aware). The "integrate" part is straightforward and, yes, there's a block for that. It's the "and-dump", which also implies resetting the circuit at the correct point in time. Once again, that's a problem of synchronization. That's not possible with GRC.
Downconversion with a Local Oscillator
This is the most straightforward way to downconvert the RDS signal. Create your own local oscillator, mix it with the RDS signal, and Bob's your uncle. It also has the advantage that it will work on any signal, whether stereo or monophonic. The drawback is that, if it is a stereo signal and if the pilot tone is synced with the RDS signal, it will take more circuitry to achieve lock with the RDS signal. While this will not be frequency locked (and, since frequency and phase are related, not phase locked, either), it should be close enough for a Costas loop (a form of phase lock loop or PLL) to lock to the signal.
Filtering the Downconverted Signal
What's the best filter to use on this signal? According to the specification, it should be a root raised cosine (RRC). As I discovered based on testing the different RDS signals in my area, the RRC is the best filter to use as it is a matched filter (filter that matches the actual, incoming signal).
Creating a Barebones Basic Receiver
We have enough now to create a basic RDS demodulator. The great thing about the RDS signal is that it is an extremely forgiving signal. If the signal level is high enough, it does not require a lot of processing in order to get a usable bitstream. We can even do so without requiring symbol sync. Because the RDS signal is an amplitude shift keyed (ASK) signal, all we need to do is downconvert it, filter it, phase lock to it, then slice it in half. The half on one side will be a digital 1; those on the other side will be digital 0. Again, this requires a fairly strong signal (SNR greater than ~13 dB). It has the advantage that we don't even need to sync to the symbols, though we do need to phase lock to the carrier. The disadvantage is that, because of the lack of symbol sync, we'll get periodic stream of bit errors. But, for the most part, we should have a signal that is good enough.
Adding Symbol Sync
The barebones basic demodulator above has some disadvantages. These are:
- It requires a fairly high RDS signal SNR. I've found that it starts to fail at SNR's of less than 13 dB.
- It does not provide symbol synchronization. Since it does not sync to the symbols, the circuit will provide bad bits as the symbol clock drifts with respect to the circuit clock.
While I've listed them as two, different problems (high required SNR and lack of symbol sync), they're actually related. If we can achieve symbol sync, then we can select optimal points to represent each bit. This allows us to successfully demodulate the bitstream even when we have much lower SNRs.
What Are The Issues of Synchronizing?
Demodulating a digital signal requires locking to the frequency and phase of the carrier, and symbols of the digital bitstream. It doesn't necessarily have to occur in that order, either.
- Frequency: Digital signals are based on constellation patterns. Constellation patterns are based on how a digital signal appears on an Argand diagram. In turn, an Argand diagram is a plot of amplitude vs phase. Frequency is a change of phase over time. This means that, if the frequency is off between the RDS carrier (at 57 kHz) and the frequency of the oscillator(s) used to downconvert it, the constellation pattern will be spinning. Timing is everything in digital signals. If the frequency is not correct, then everything else will be off.
- Phase: Once the frequency is settled, then you'll need phase synchronization, especially as this is, essentially, a phase shift keyed signal.
- Symbol: Digital signals will have a point at which they need to be sampled in order to measure the correct amplitude. This is a particular point in time of the signal.
The general order for achieving these in Gnu Radio are:
- Downconvert using either a local oscillator set for 57 kHz or, if the FM station has a 19 kHz pilot tone, using a triple-conversion to create a 57 kHz oscillator. Even using a local oscillator should get you close enough for the follow-on circuits to achieve lock, either symbol or phase.
- Symbol sync using the (appropriately named) "Symbol Sync" block. (NOTE: The "Polyphase Clock Sync" block is being deprecated. The "Symbol Sync" block is the new hotness.
- Finish phase locking to the now-synced symbols. This can either be as simple as a Costas loop to achieve general phase lock, or using a "Constellation Decoder" set to "BPSK". This latter will phase lock and recover bits based on the output of the "Symbol Sync" block.
Obtaining Symbol Sync
One of the reasons for this post is that the block I used in my original flowgraph for symbol sync, the "Polyphase Clock Sync", is being deprecated. I had to change it. Another big reason for relooking at this receiver is Prof Jason's videos on software defined radio. I really understood the symbol synchronization much better after watching those videos. Combine that with fred harris's book "Multirate Signal Processing for Communication Systems" and you have the information needed to create a symbol sync circuit (sort of).
What's an Error Signal?
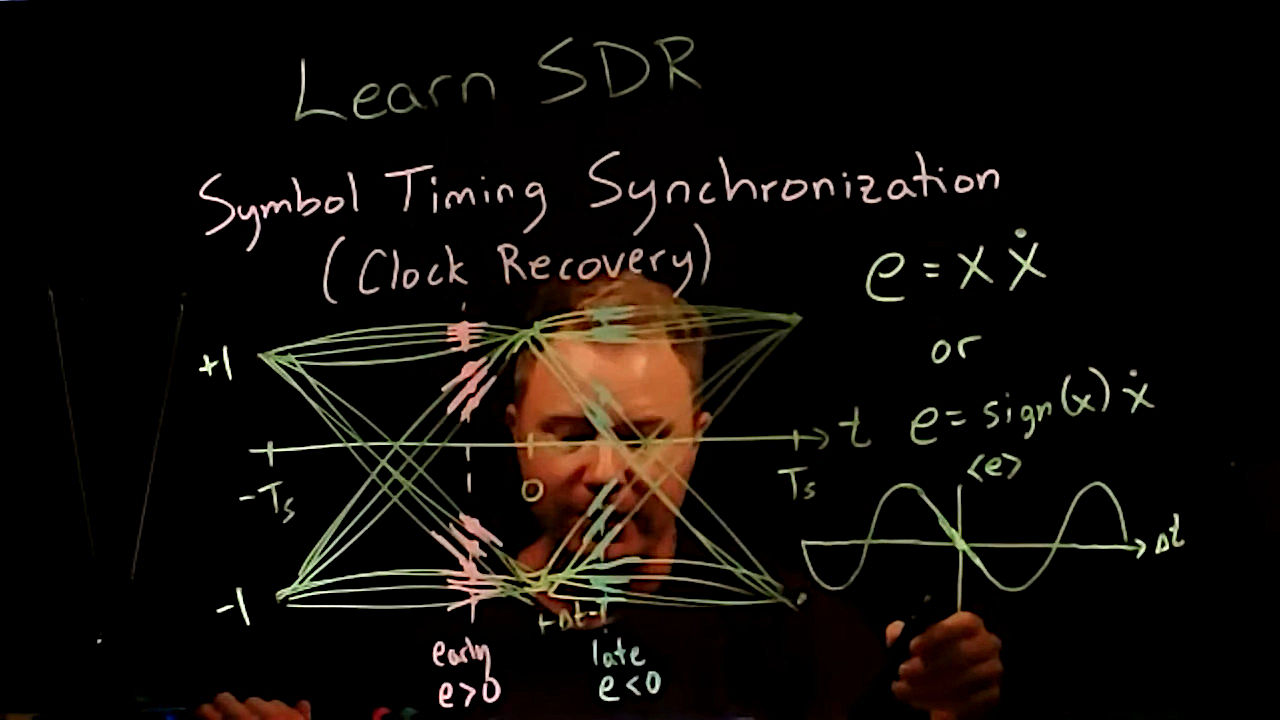
Let's start with Prof Jason's video on symbol sync. Yes, it's 46 minutes long. It's also well worth the watch. He explains what Dr. harris explains in his book.
Let's say we have a demodulated digital signal which came from a carrier in which we had both frequency and phase synchronization. A RDS signal would appear as shown below:
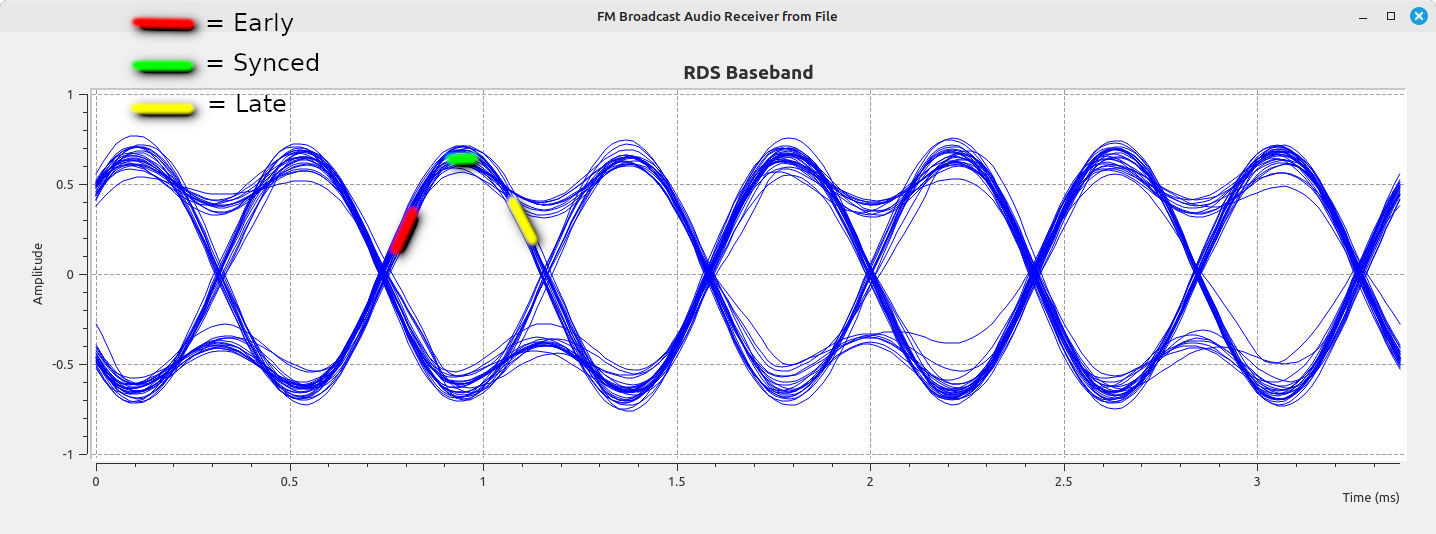
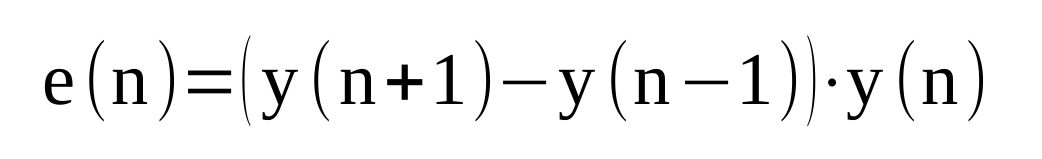
We can create a signal, called an error signal, which would be the signal equivalent of what your eyeball is doing. When the signal is near zero, you're close to the sync point. When it's not at zero, you're not at the sync point. fred harris calculated that this error signal could be approximated with the following equation:
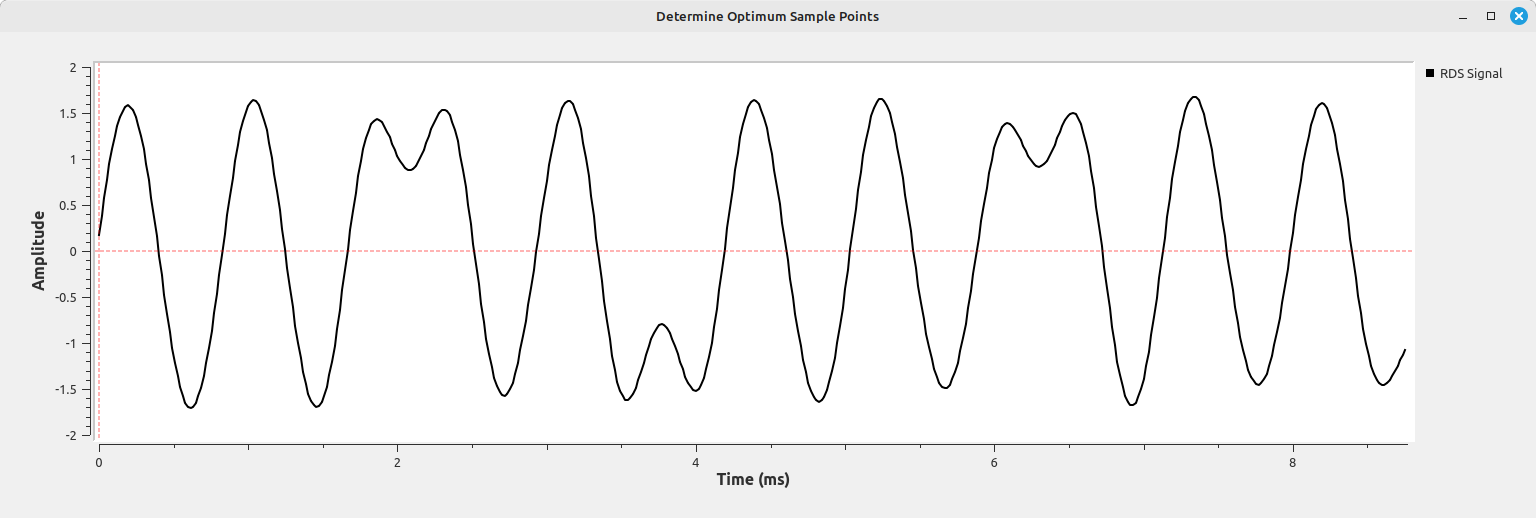
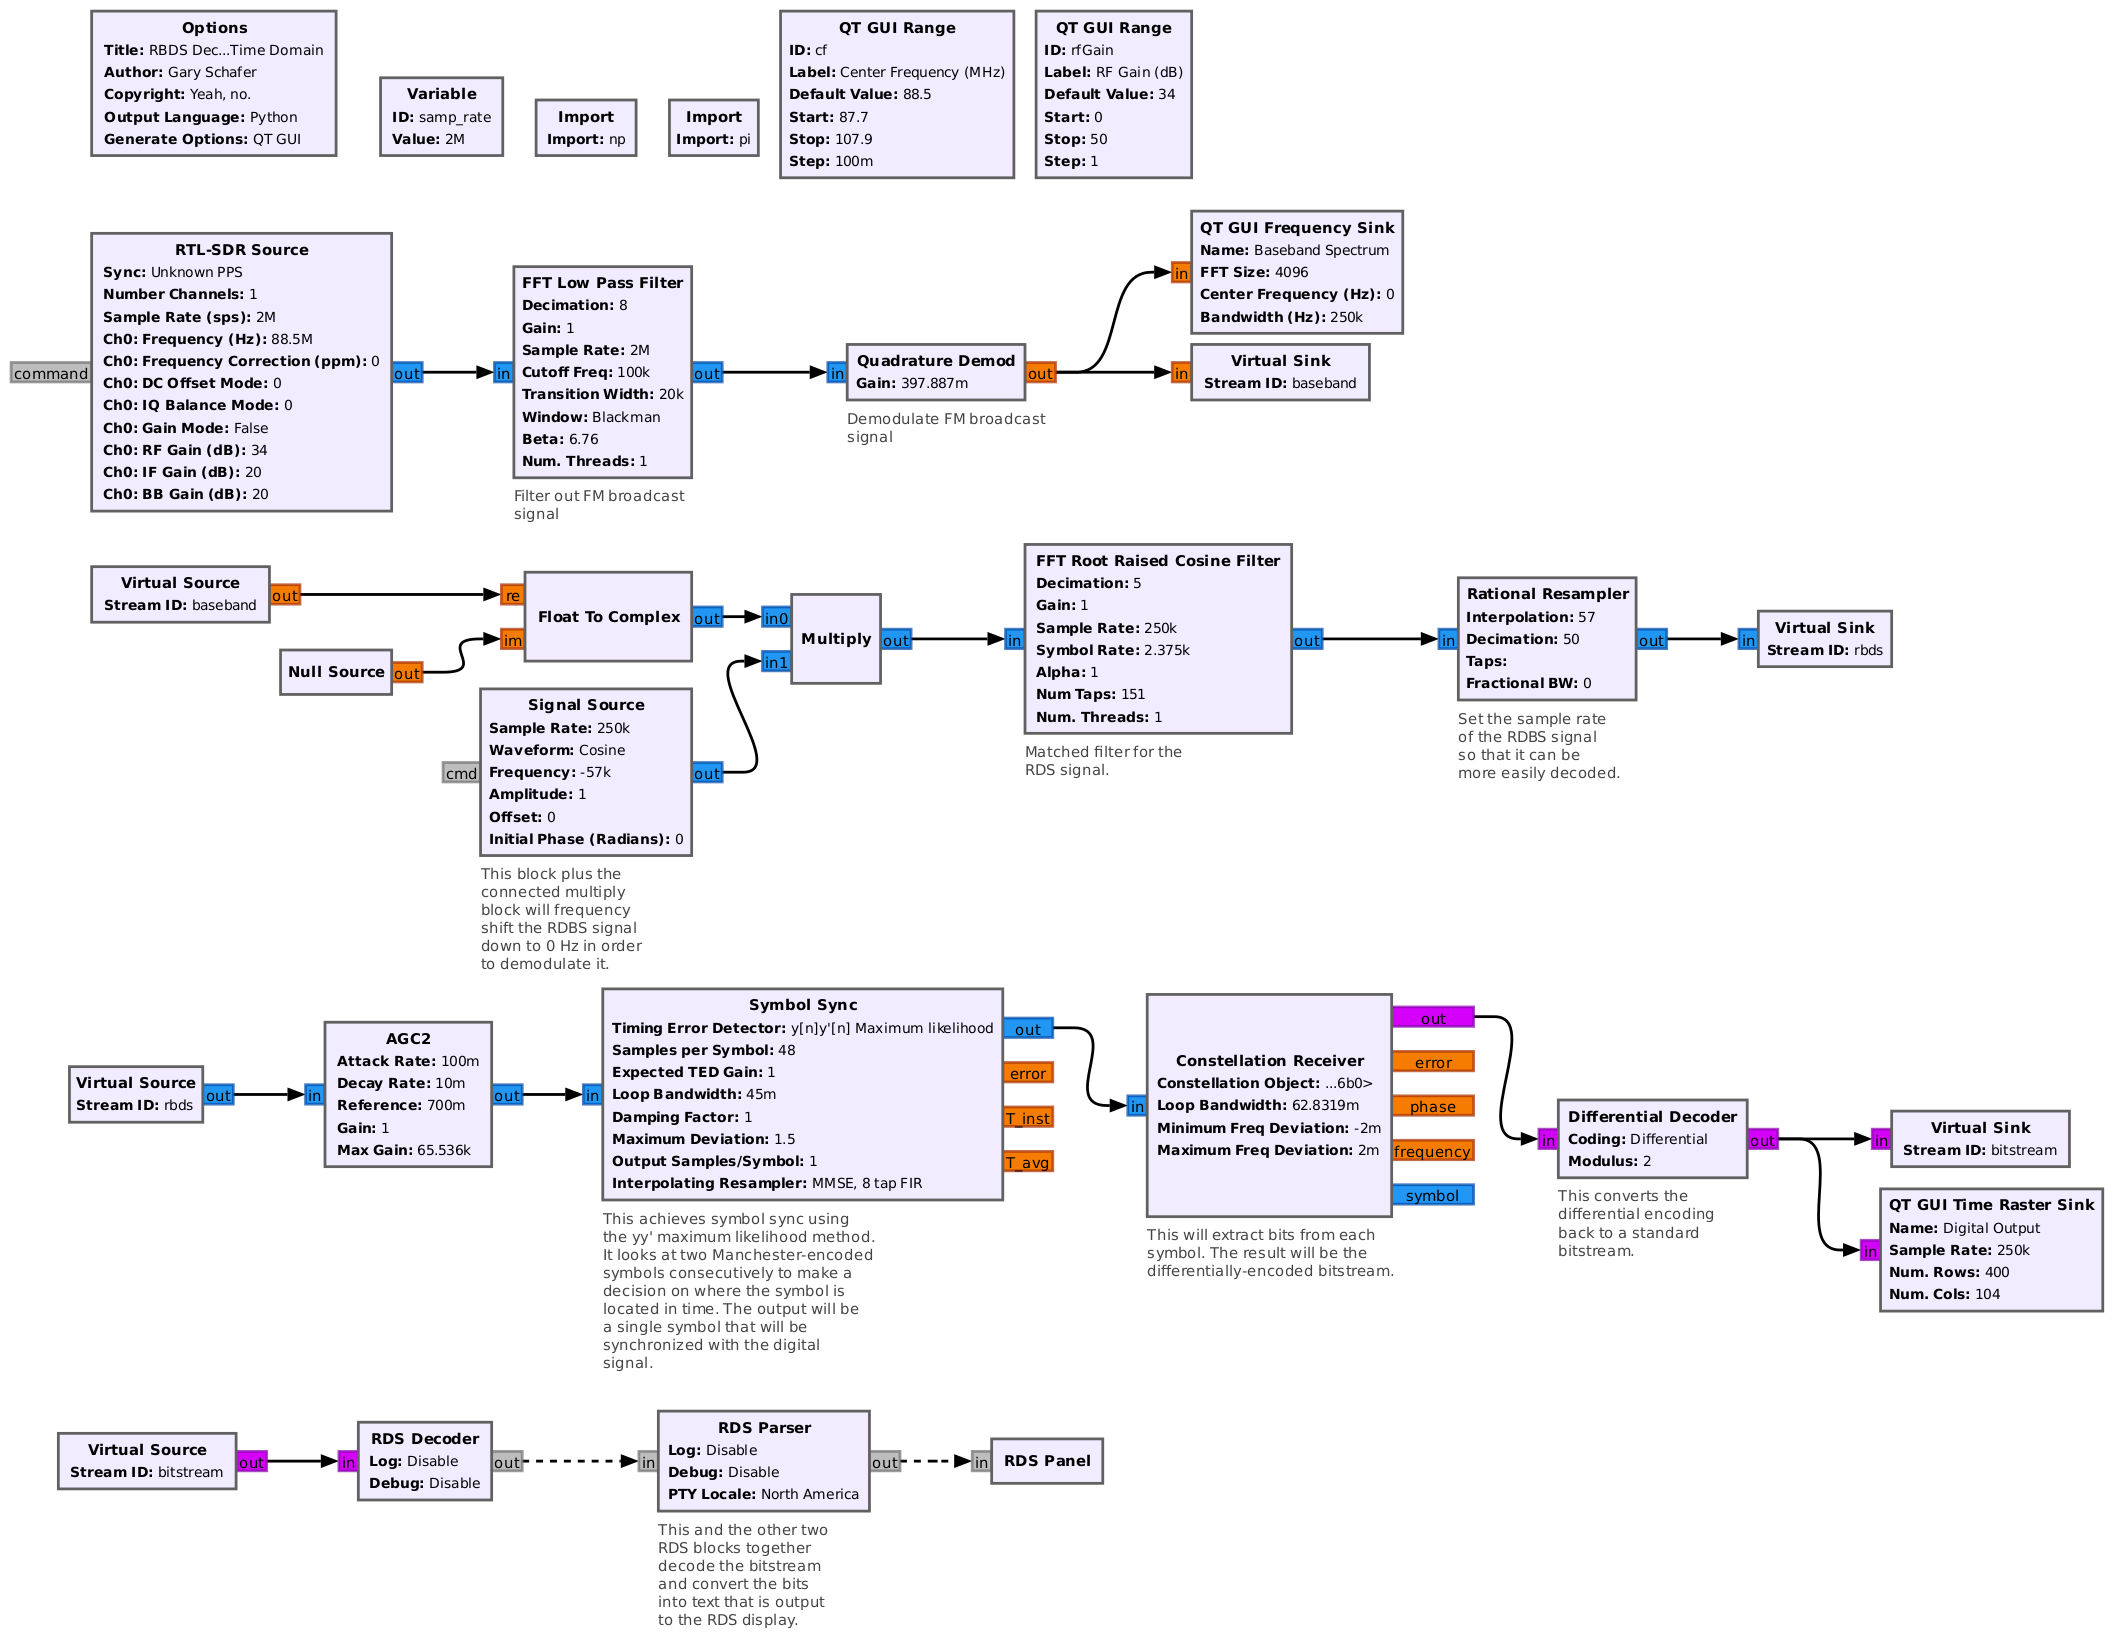
I was able to make a flowgraph that creates an error signal as well as impulses at the appropriate symbol points.
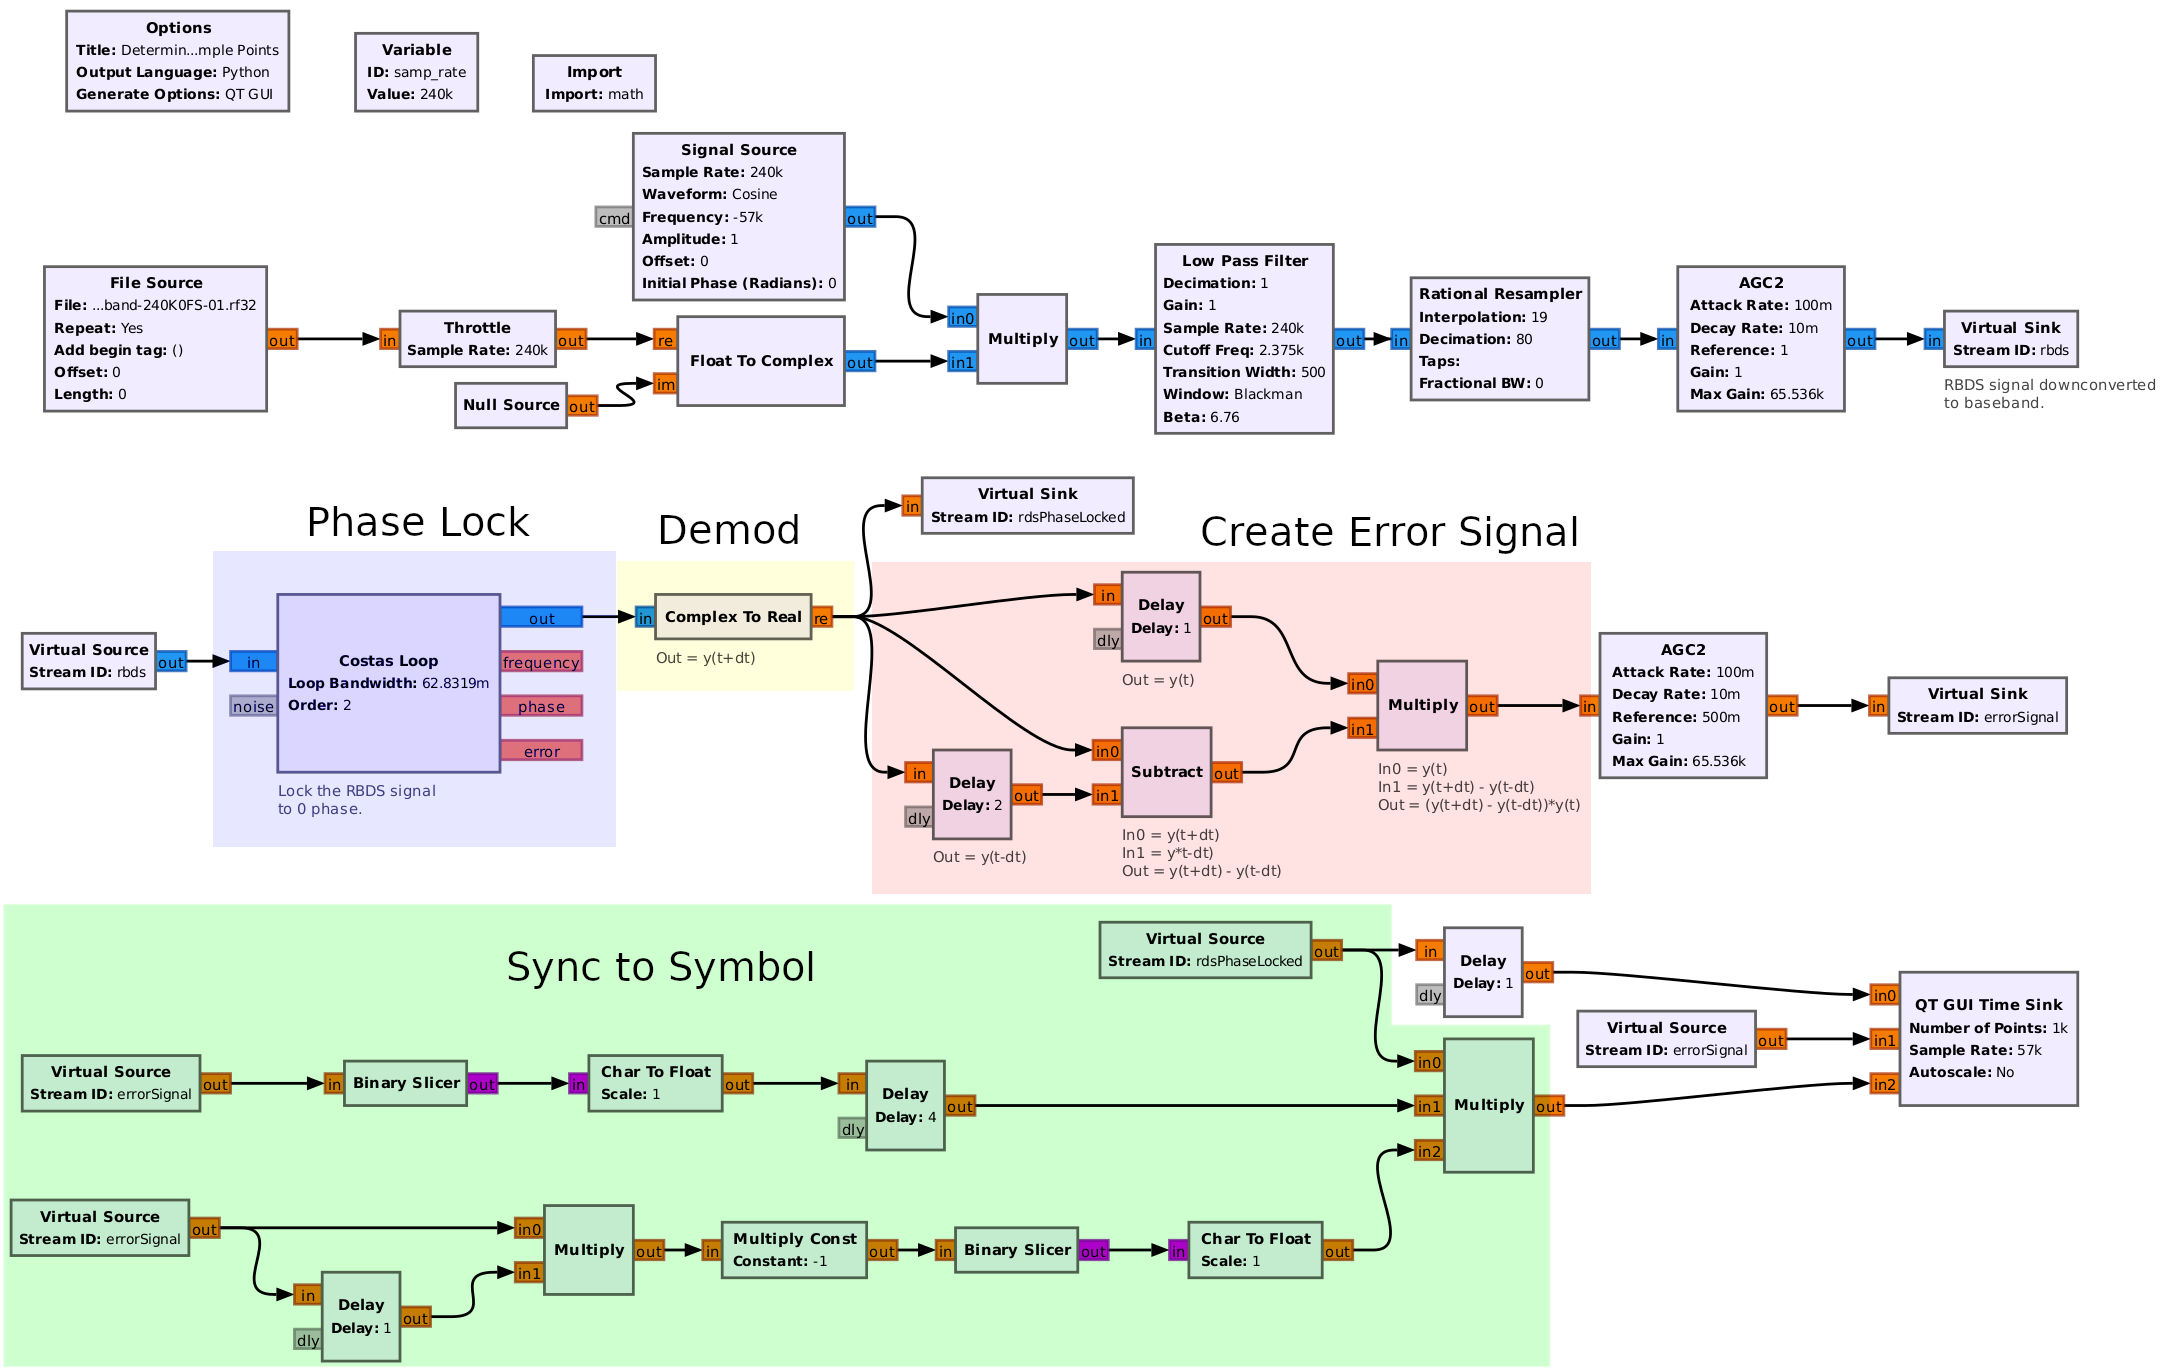
Running this flowgraph, we get the following:
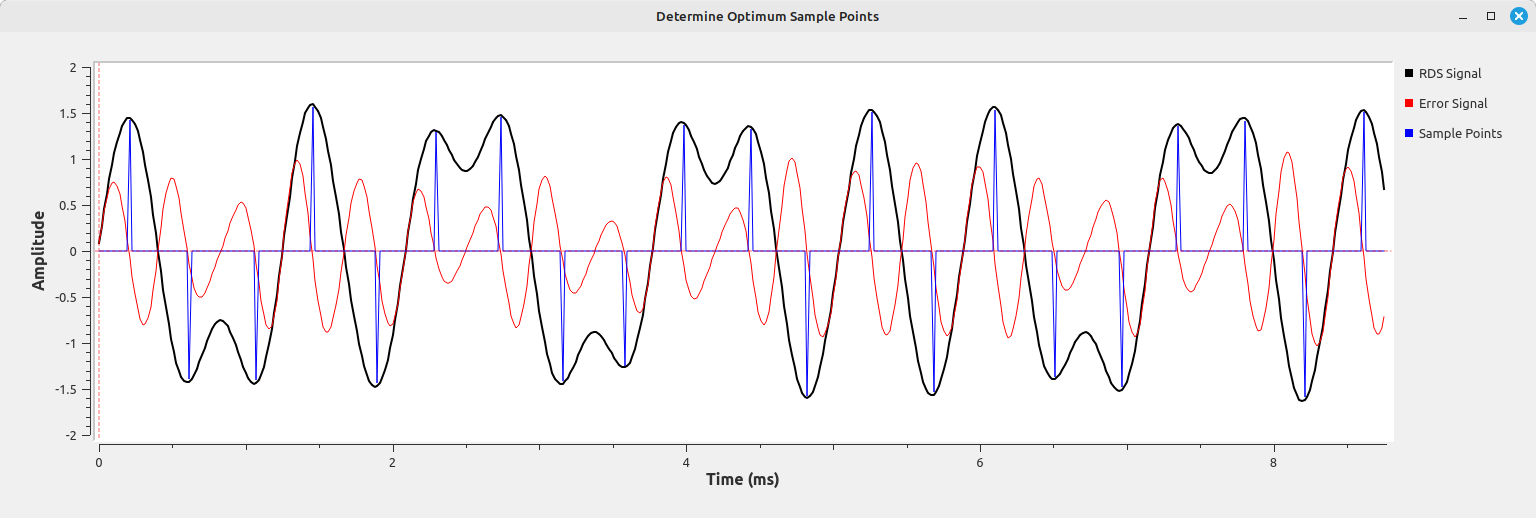
A couple things to bear in mind are:
- You need transitions. The more the signal goes from a 1 to a 0 or from 0 to 1, the better the synchronization.
- You need multiple samples per symbol. By combining the signal and the differential of the signal, you can figure out the point at which to sample the symbol properly.
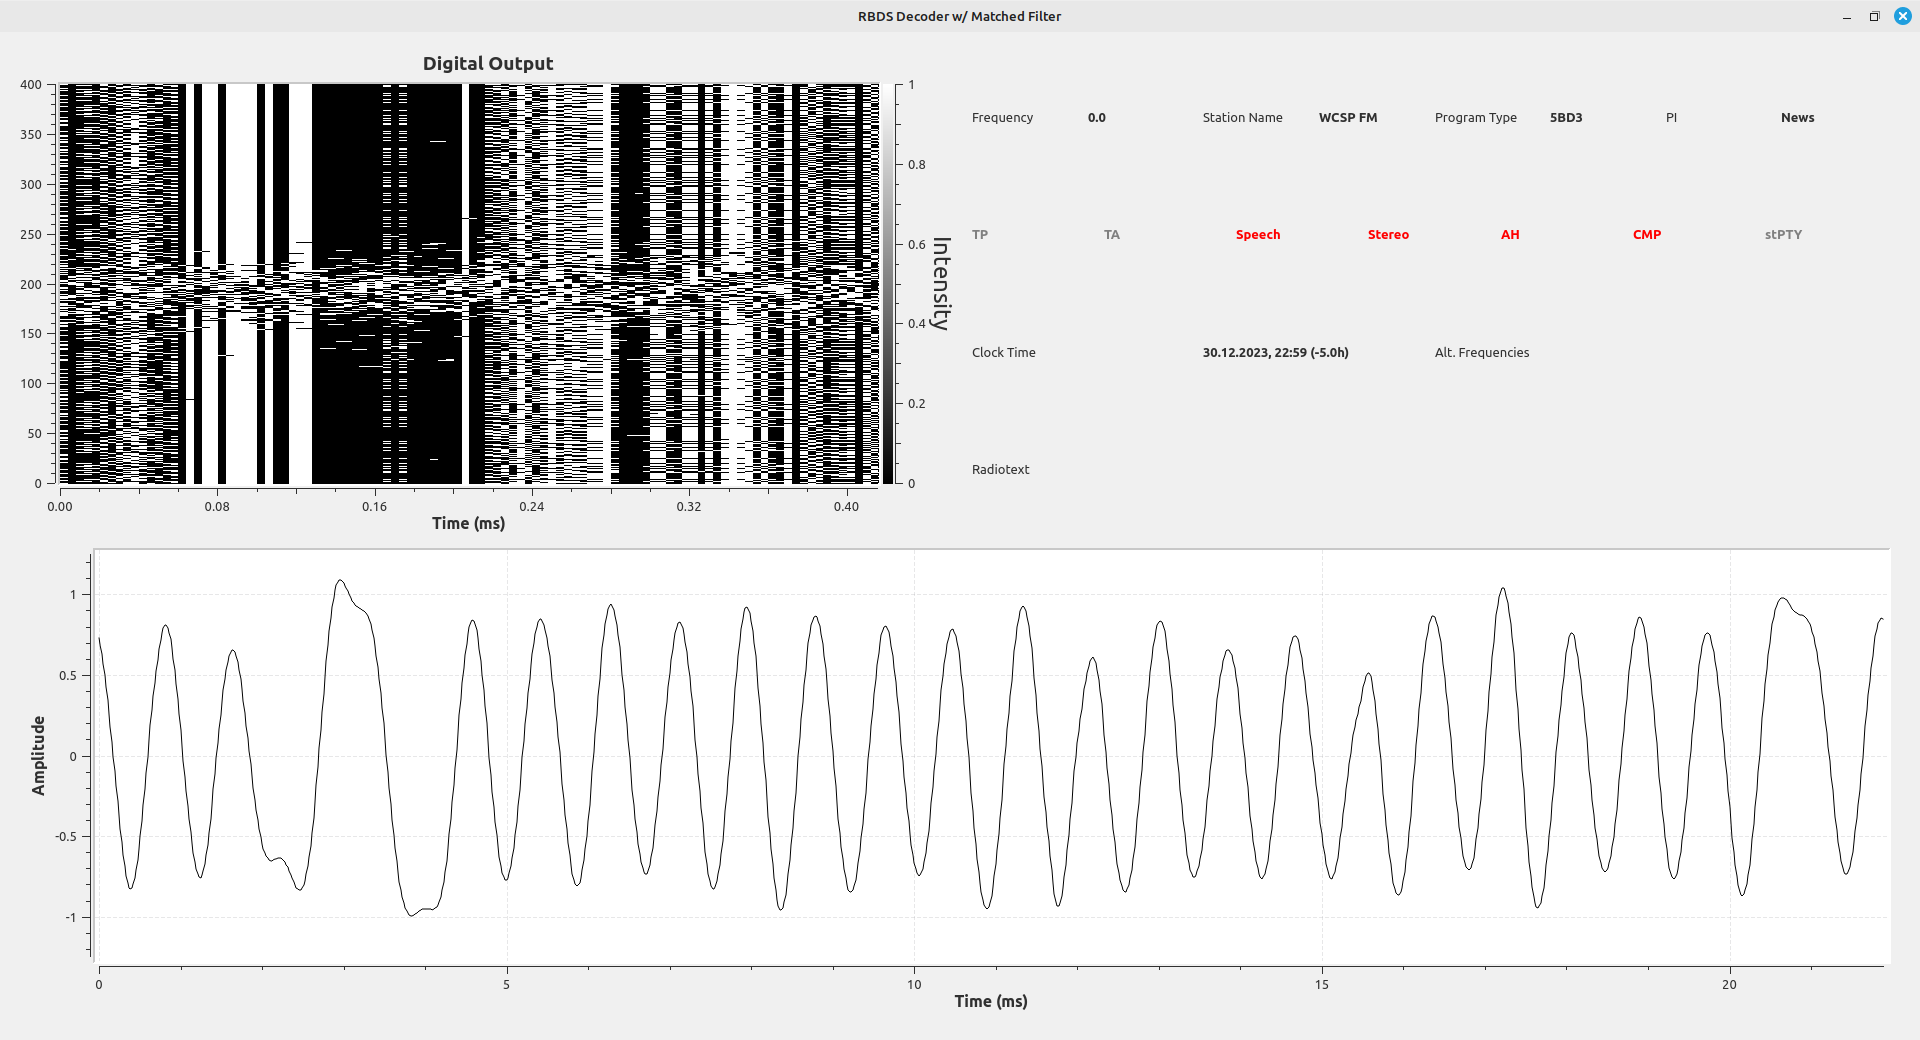
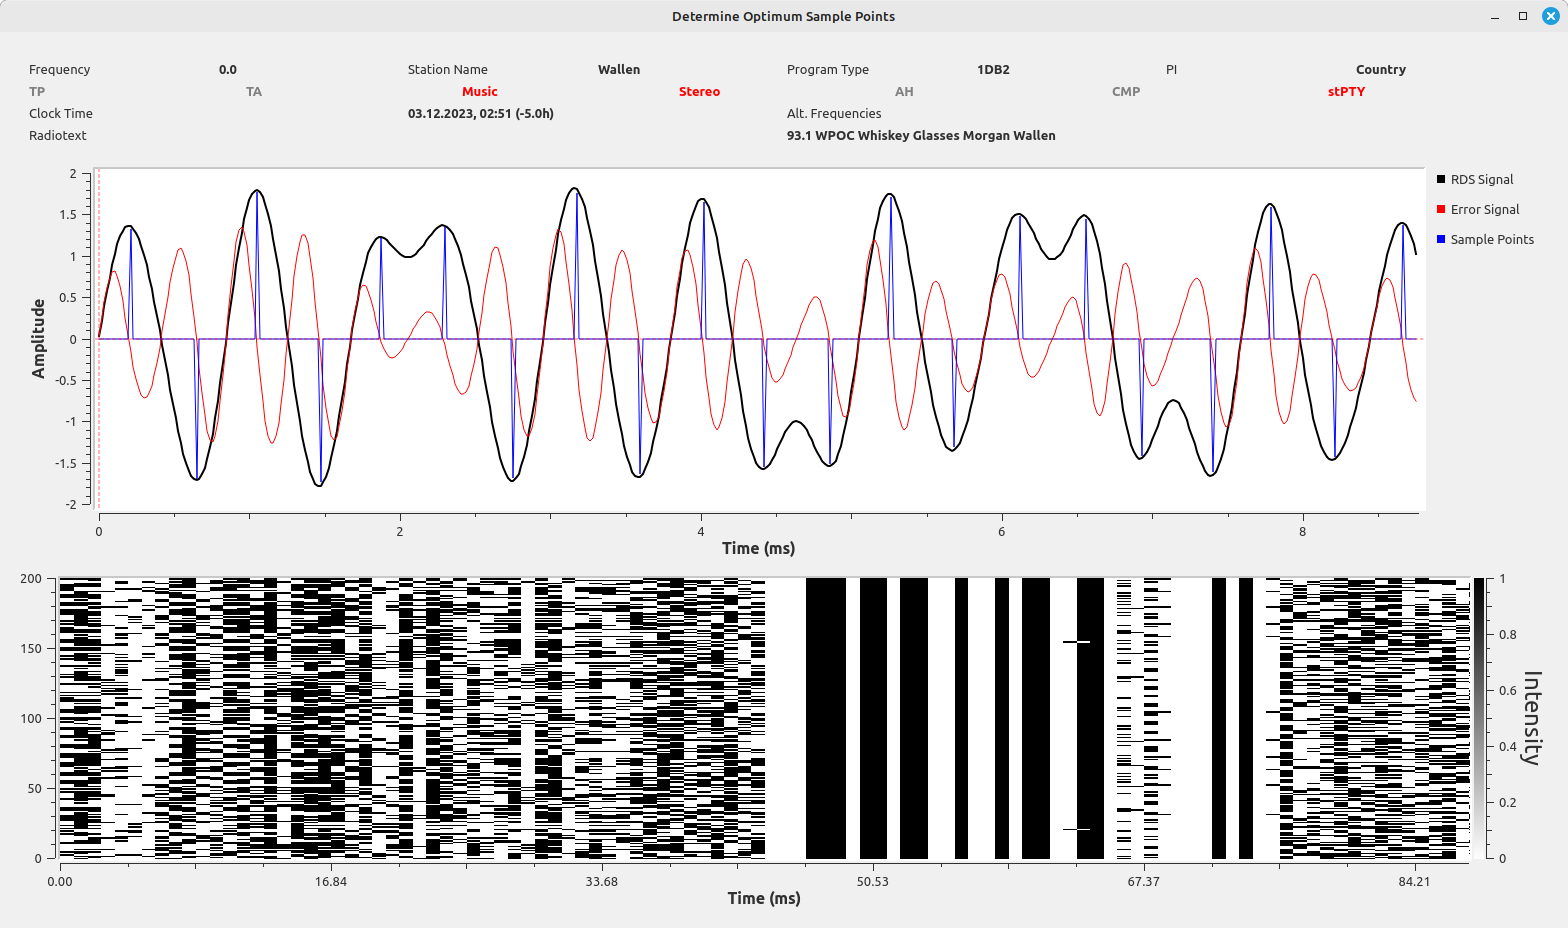
It turns out that you can slightly modify the flowgraph above to recover the data bits. By changing the impulses into rectangular pulses, changing the signal to binary (using the "Binary Slicer" block), picking out every 48th sample (creates the correct bit rate plus it removes the biphase encoding), and performing a differential decoding, this signal can be fed into the RDS blocks in GRC.
Adding the Symbol Sync Block
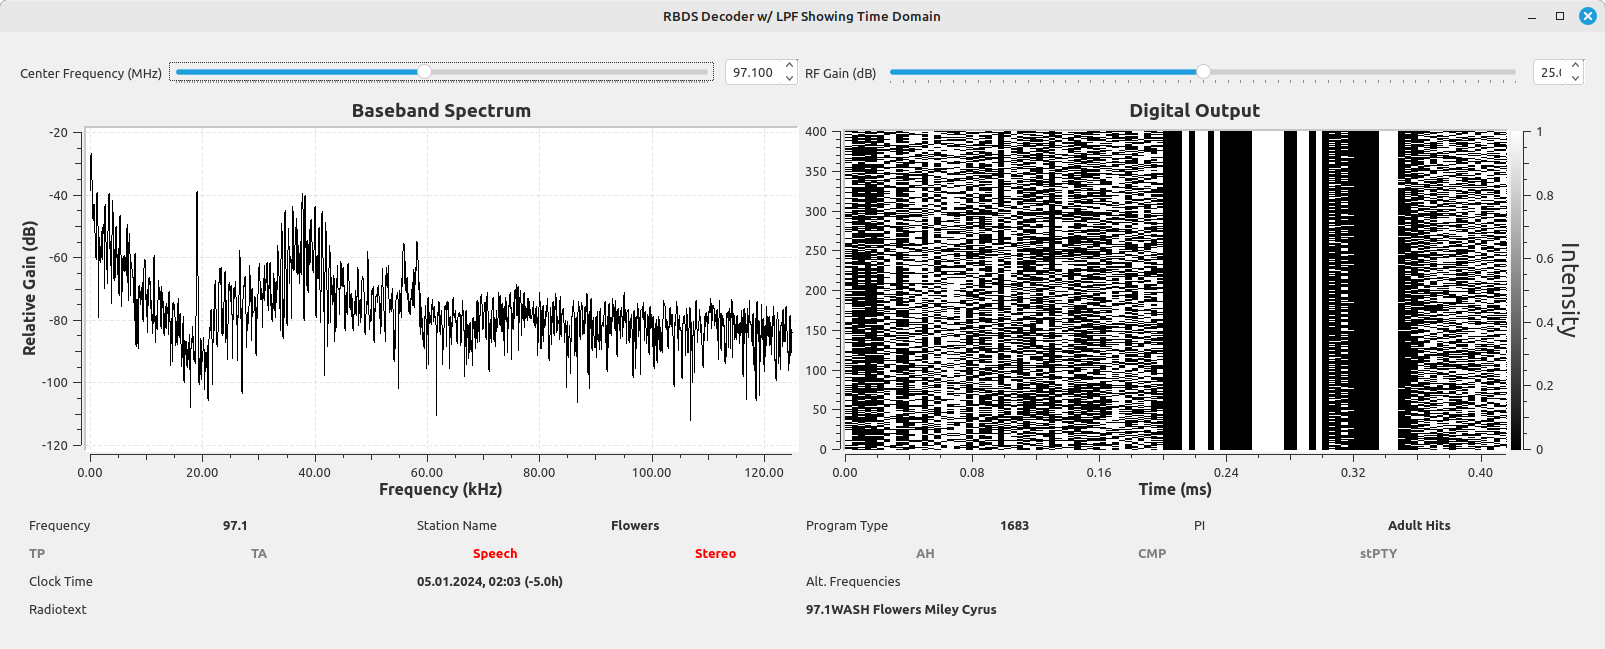
Now we can add an actual "Symbol Sync" block. This block can essentially perform the same as the flowgraph above, except it has feedback which adjusts the symbol rate to keep it synchronized with that of the signal. The result is a flowgraph that perfectly demodulates RDS signals when the RDS SNR is greater than about 7 dB. That was a total of 18 out of the 38 stations. It also provides a usable decode (though with errors) down to about 4 dB, which was another 12. That means this flowgraph provided decoding of 30 out of the 38 available. The flowgraph appears as follows:
A quick note. The "Constellation Receiver" block performs the actual BPSK demodulation. If I understand it correctly, this block first does a Costas loop to frequency and phase lock to the signal. According to the documentation, it uses constellation points close to each other to estimate the frequency offset. It then does a hard decision to determine the symbol to bit mapping. I think it's performing a Euclidean-distance calculation for each constellation point. (Remember: the previous block determined the proper sample point, but didn't correct any frequency or phase error.) Based on the distance of each point to what it thinks it should be (again, amplitudes are important!), it makes a decision on whether it's a 0 or a 1. This is followed with the differential decoding. After that, the bit stream is ready for the RDS decoder and parser blocks.
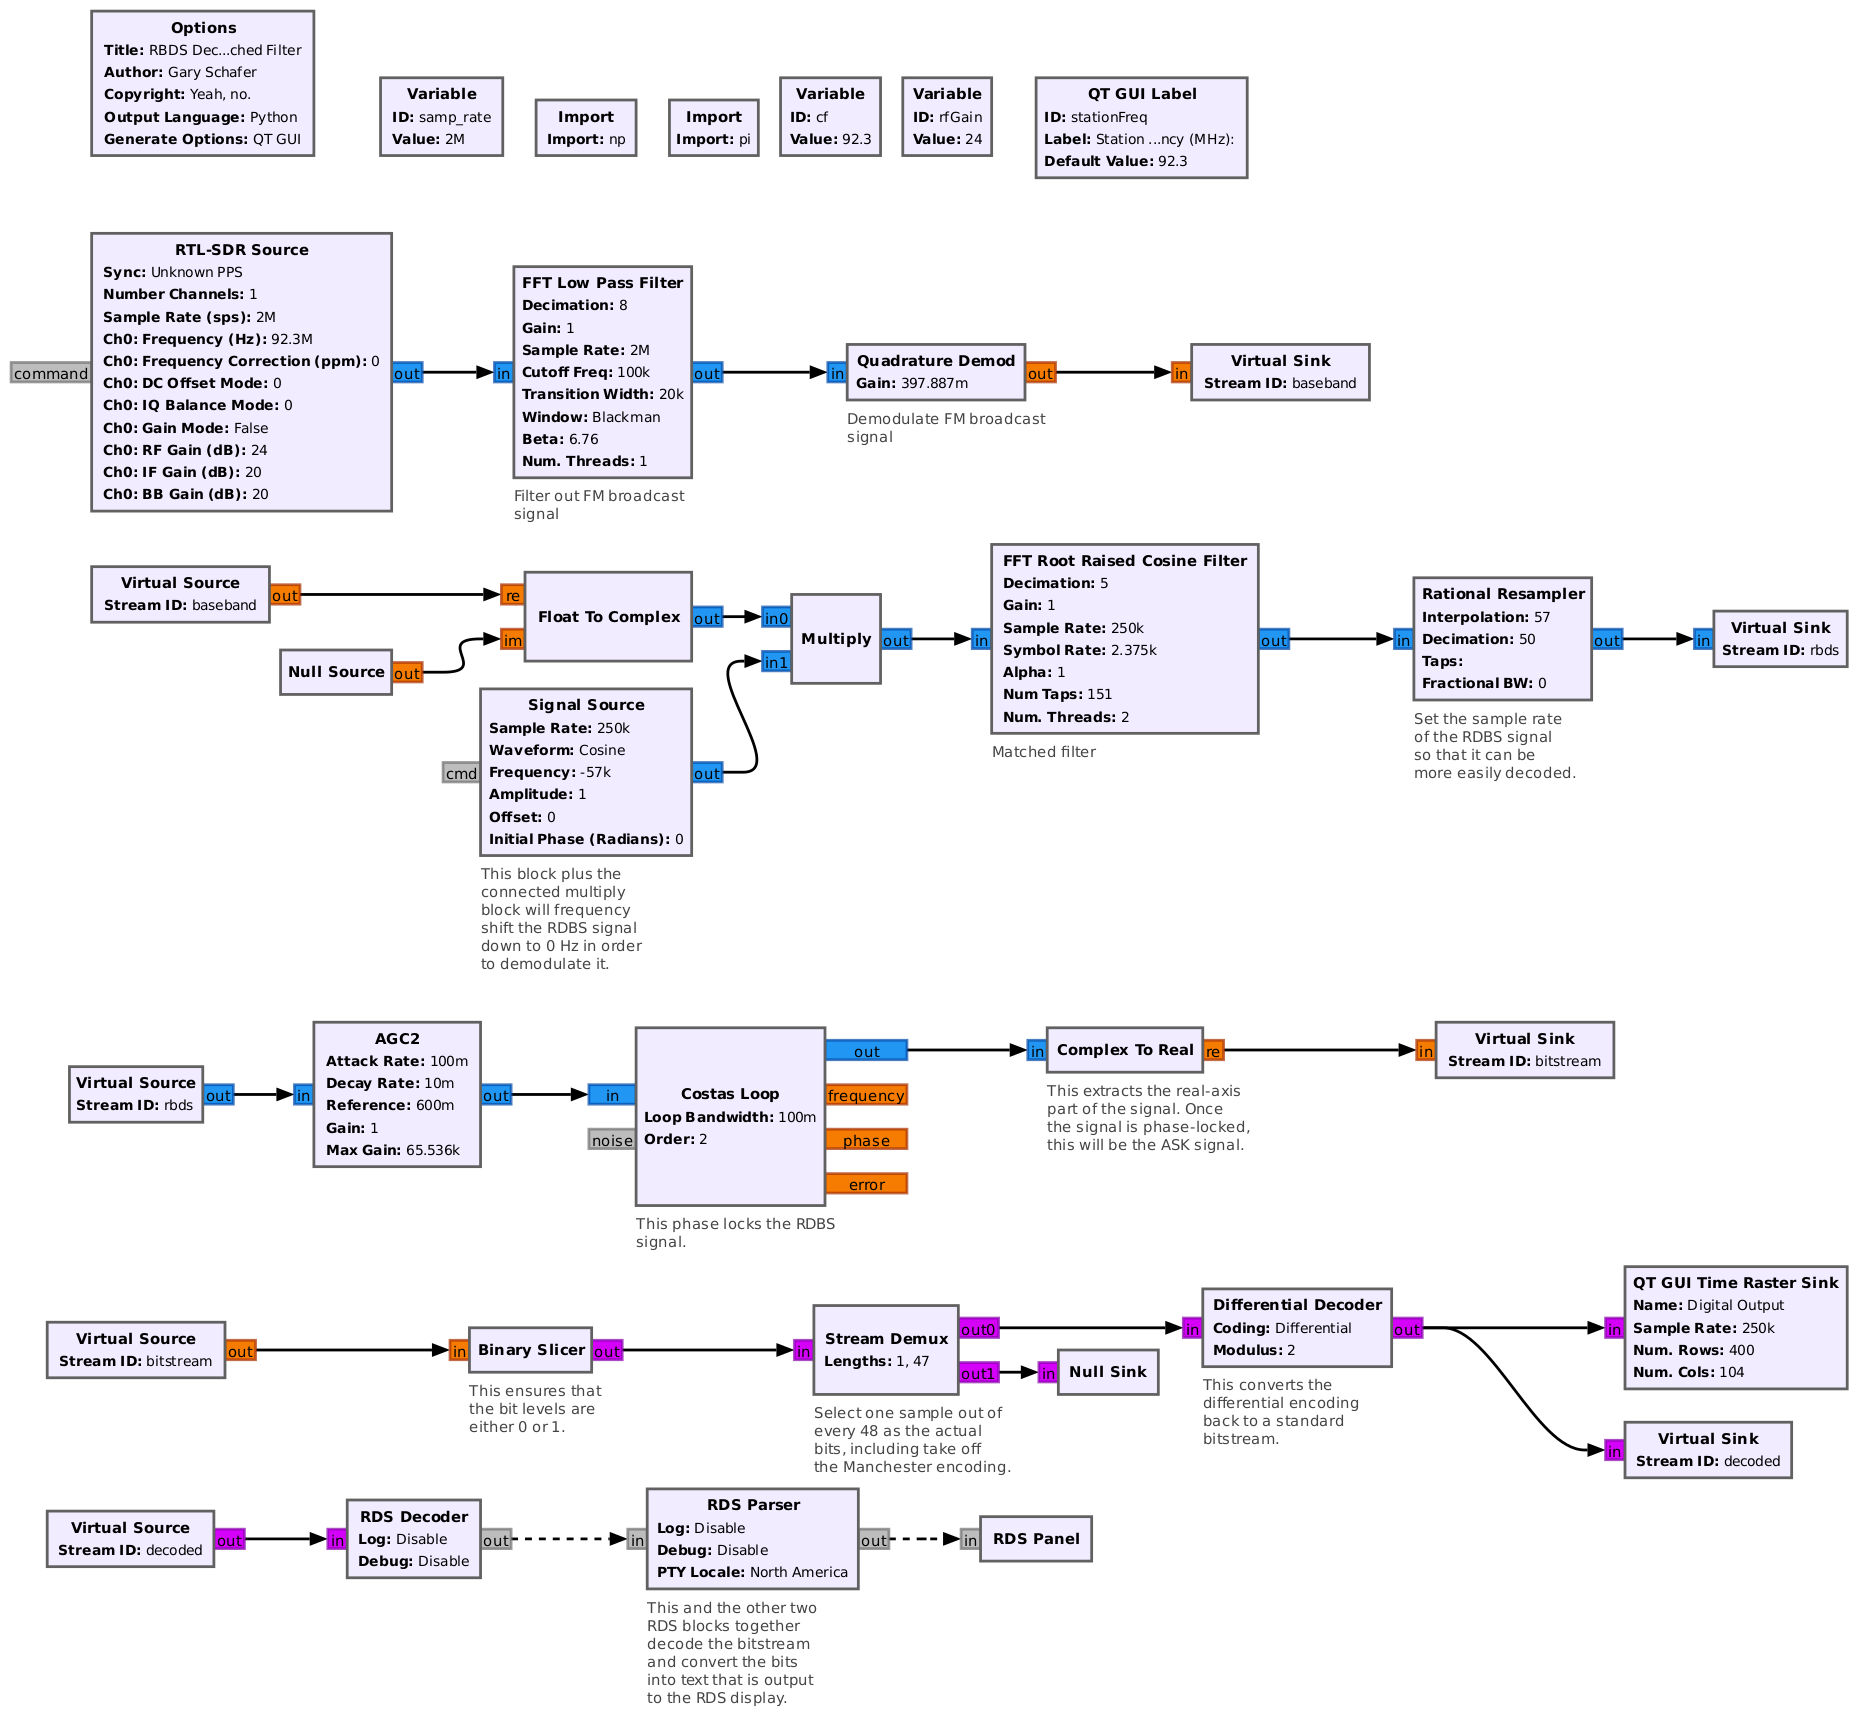
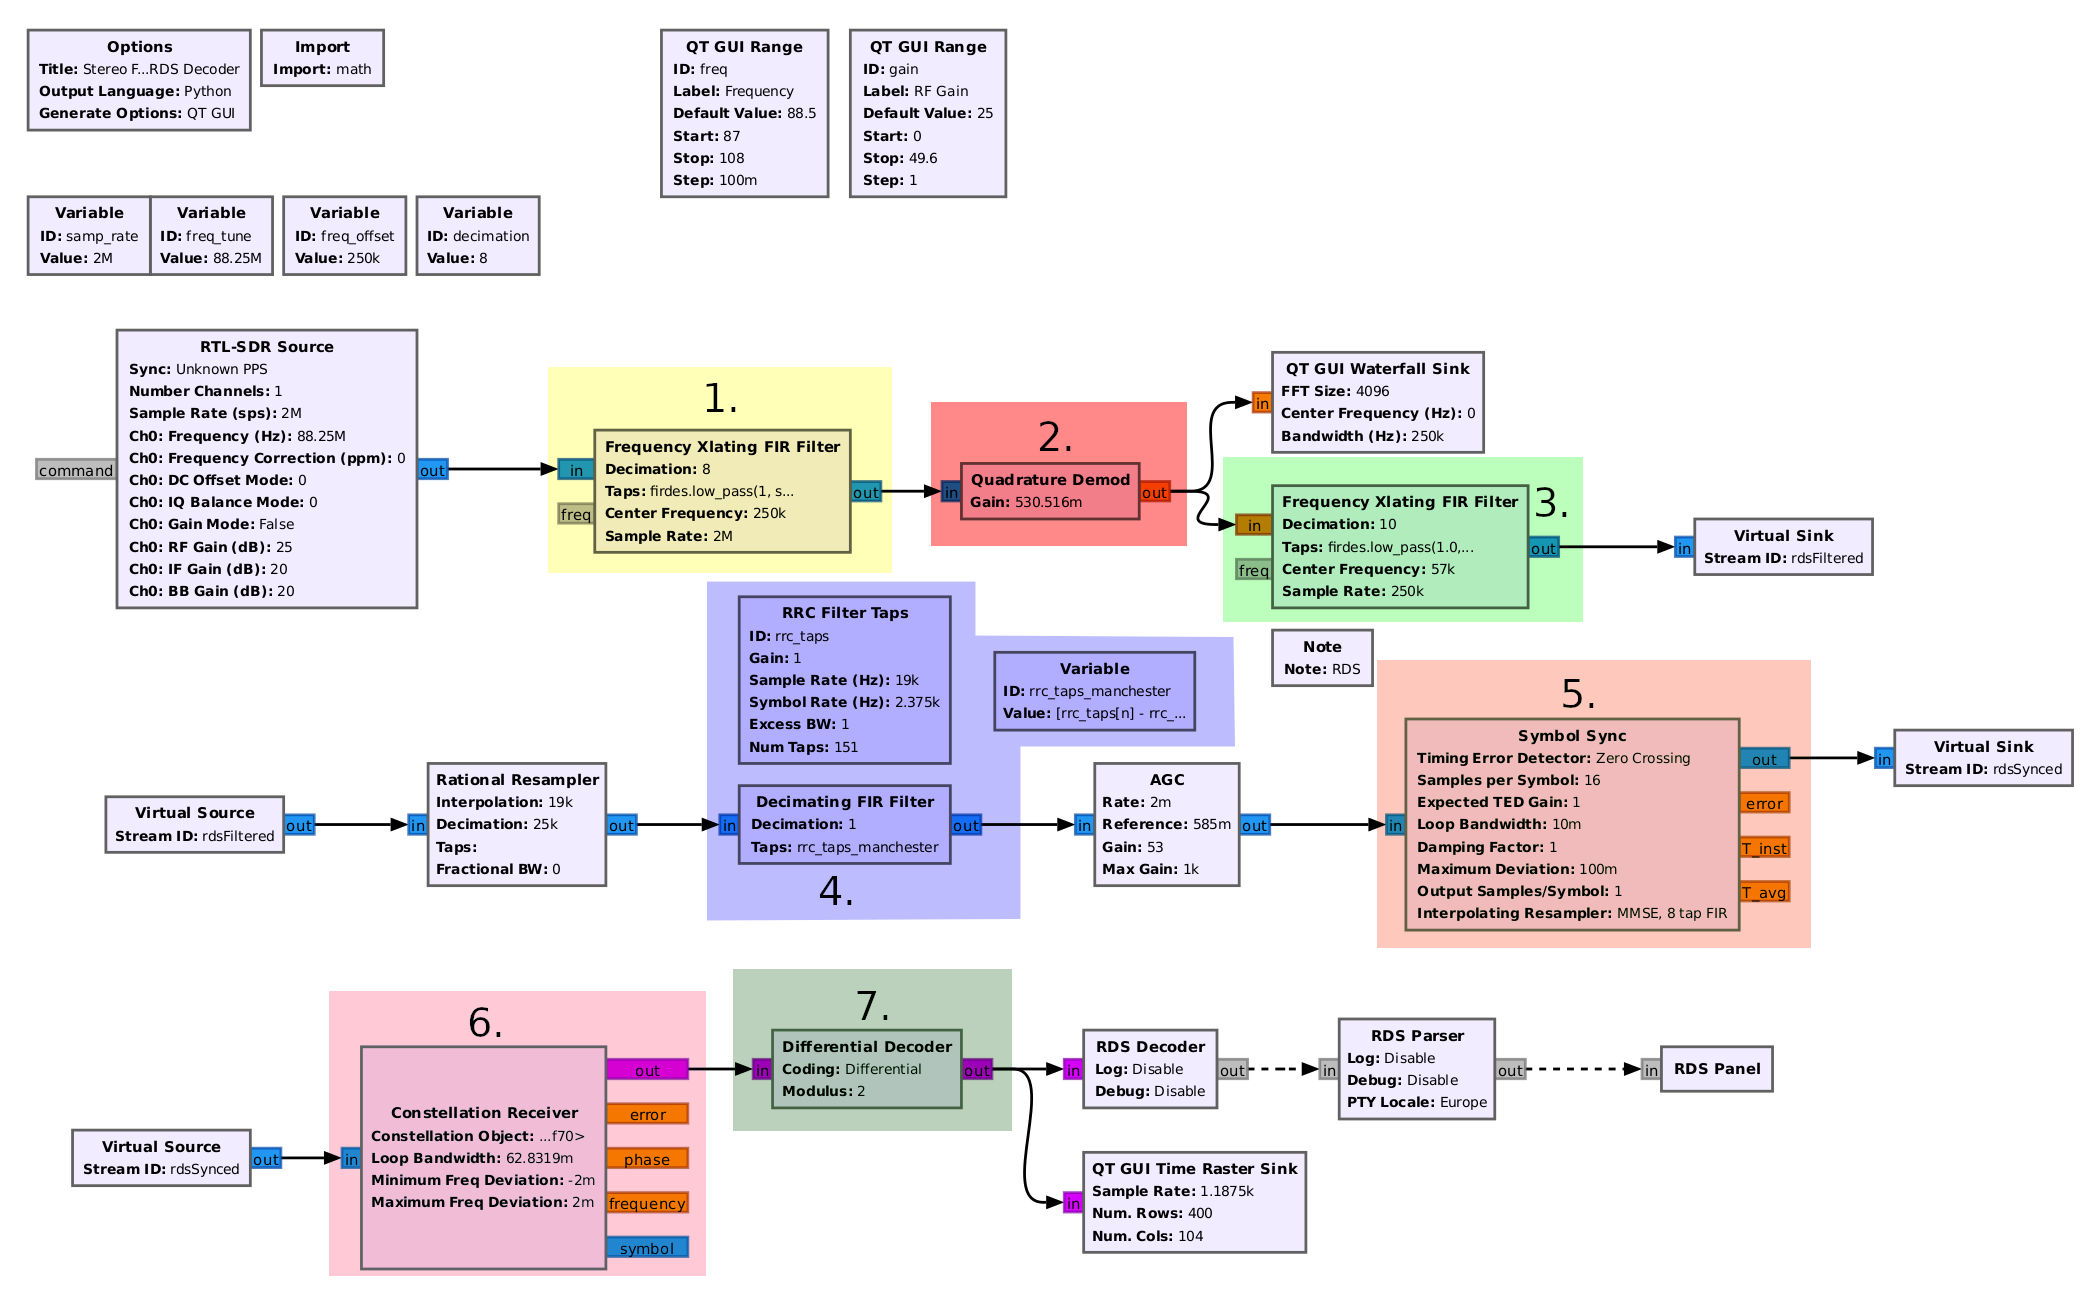
Looking at Bastian Bloessl's RDS Receiver
I wanted to compare my flowgraph with Bastian Bloessl's RDS decoder. Looking at his flowgraph, everything is pretty standard through the initial FM station filter and demodulation. He uses a basic complex frequency shift to shift the RDS signal down to baseband. This means it will work with any FM station, stereo or monophonic, since he's not relying on the 19 kHz pilot tone of a stereo signal. While I didn't point it out in my image above, he changes the sample rate from 25 kHz to 19 kHz. This will make it easier to perform the symbol sync and constellation decoding. The reason is that the symbol rate of a fully-encoded RDS signal is 19 kHz / 8 = 2375 kHz.
It's the next, two parts that really set it apart. The first is the filtering. Rather than a straightforward RRC lowpass filter, he uses an impulse response of the full Manchester-encoded filter. The other significant difference is that he uses the "zero crossing" algorithm in the "Symbol Sync" block.
A sidenote: The AGC was interesting to me because it didn't use the defaults. All of the values seemed very deliberate. Come to find out, it's important that the amplitudes going into the "Symbol Sync" meet certain values, especially for certain timing error detectors (TED). The "zero crossing" detector is one such TED. This is a basic detector that essentially counts how often a signal crosses zero (both positive and negative going) to determine its clock rate. The second aspect is that he's selected 16 samples per symbol. This means he's using a symbol rate of 1187.5 bits/sec. This is the unencoded bit rate of the RDS signal. The output is performing both symbol sync and Manchester-decoding at the same time. (NOTE: Again, this only works because of the differential encoding that follows. Without that differential encoding, it would be necessary to separate the symbol sync and Manchester decoding.)
Bloessl's RDS Flowgraph Performance
I'm going to say this upfront. Bloessl's flowgraph works best overall. When I ran it against all 38 FM stations I can receive, it perfectly decoded 26 of them, and had usable decodings for another 6. This meant that, out of 38 signals, it could provide decodings for 32 of them. This was better than my flowgraph by 2 (my flowgraph only provided usable outputs for 30 out of the 38), and for several stations, Bloessl's flowgraph provided perfect decodings whereas mine would provide some errors.
Wrap-up
There you have it. Several ways in which to demodulate RDS signals. If you're just getting into signal processing, this will hopefully provide you some avenues for further exploration.