
Random Quote Board
NOAA APT with Gnu Radio: UPDATED
Gnu Radio has changed a fair amount since my post on demodulating and displaying NOAA APT signals. I've decided to update my Gnu Radio flowgraph due to the changes between Gnu Radio versions 3.7 / 3.8 and the current 3.10.
Updated Gnu Radio Flowgraph
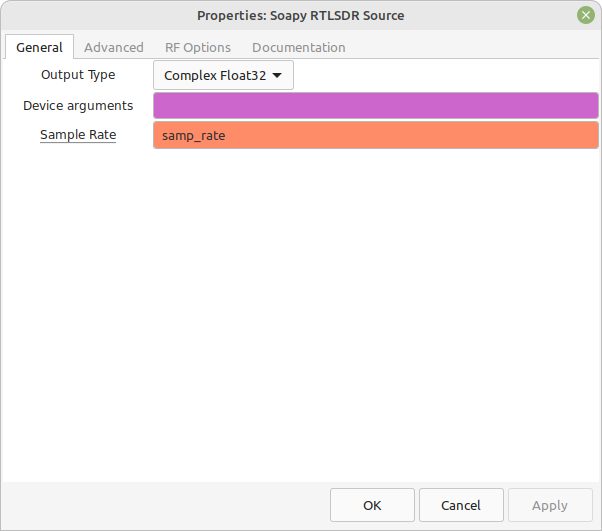
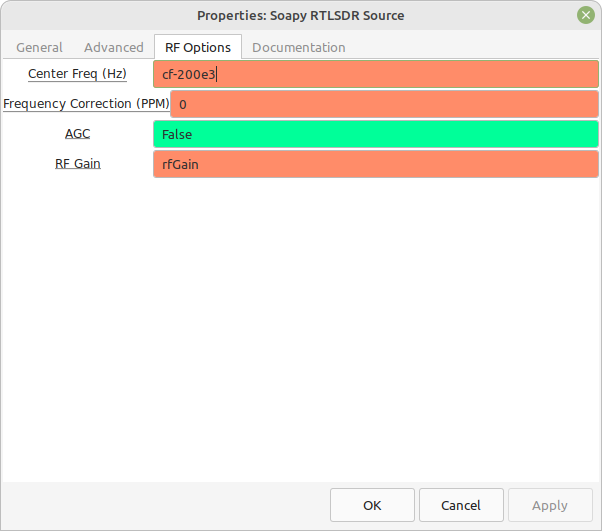
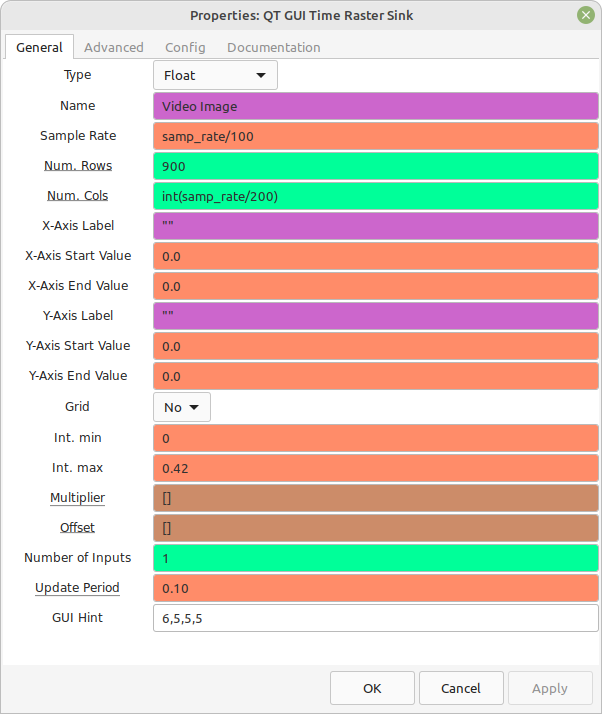
The biggest change is with the RTL-SDR source block. The new one is the "Soapy RTLSDR Source" block. This new block restricts the number of available sample rates to a small number. The first flowgraph used a 1 MSa/sec sample rate, but the new Soapy block doesn't allow that rate. I've changed the rate to 1.024 MHz, the closest one. This required changing the interpolation and decimation values of the "Rational Resampler" block, as well as adjusting the values in the "QT GUI Time Raster Sink" and "QT GUI Time Sink".
I've also removed one of the lowpass filters before the demodulator. The bandwidth of the remaining lowpass filter might need to be adjusted downward. For example, you might try to lower the "Cutoff Freq" to 25 kHz.
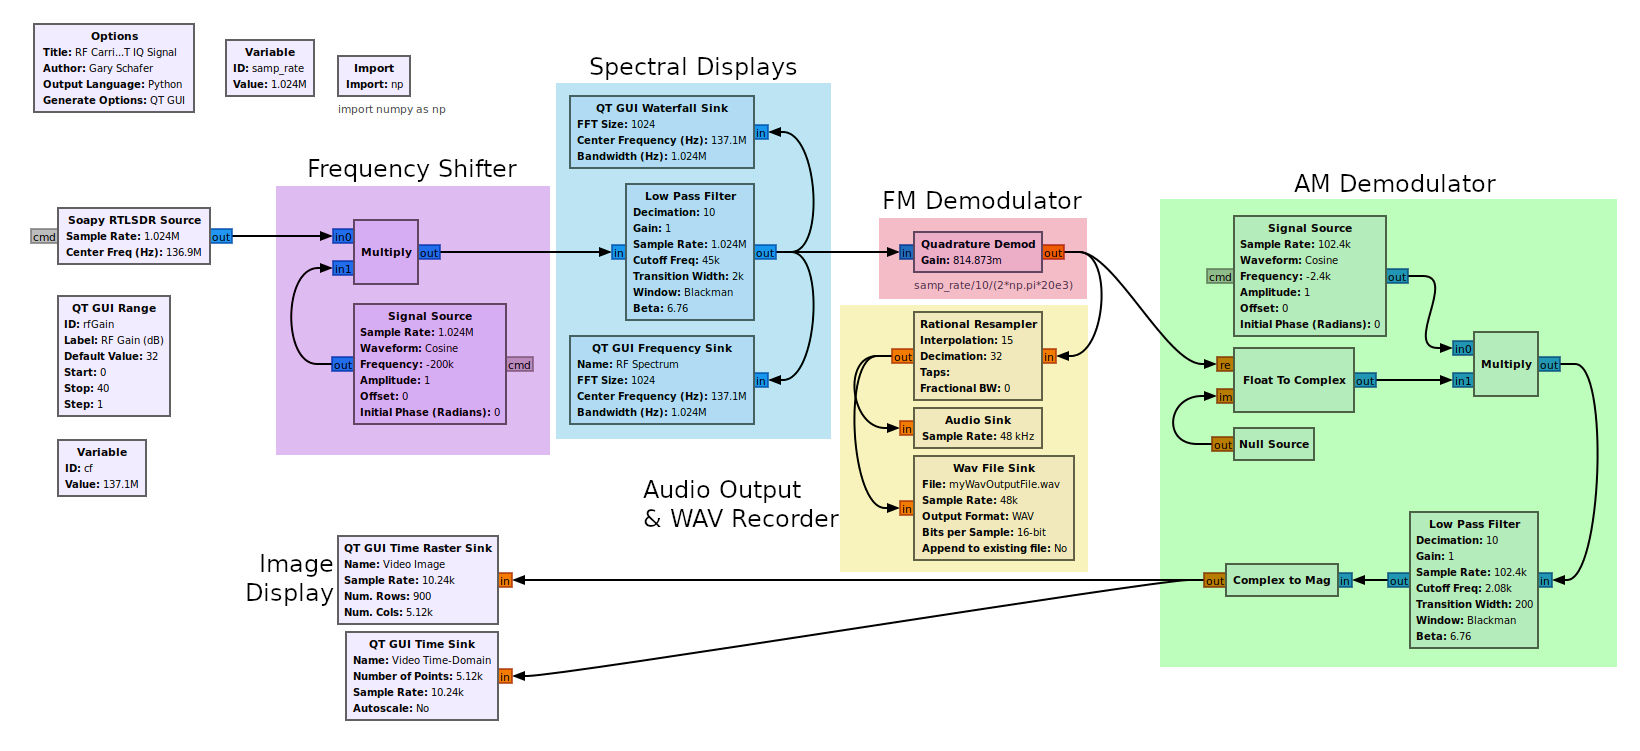
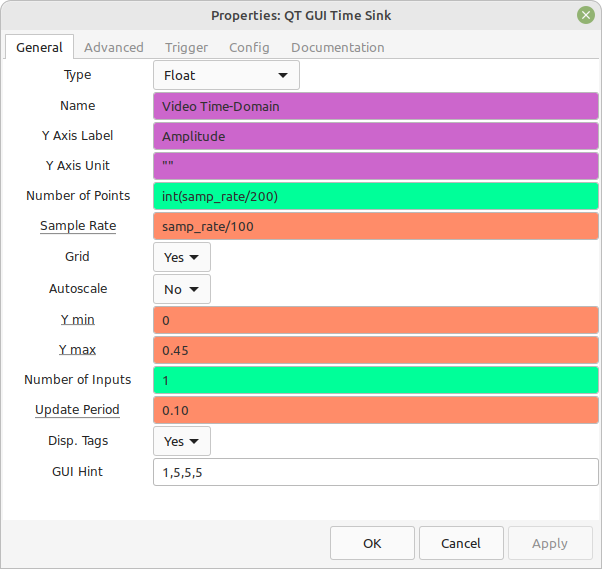
Here are the properties for some of the most important blocks. Not shown is the "Rational Resampler", but the interpolation and decimation values are shown in the main flowgraph diagram above. All of the other blocks are the same as the first post.
While there are minor changes in the flowgraph, the general steps remain the same. First step is to collect the NOAA APT signal itself. This is the job of the "Soapy RTLSDR Source" block combined with the "Multiply" and "Signal Source" blocks. The lowpass filter isolates the signal itself. The "Quadrature Demod" block extracts the information from the primary RF carrier. The following AM demodulator extracts the video signal itself from the AM subcarrier. The time raster sink creates the image.